Much of the nation’s midsection has been enjoying temperatures more typical of April than February for the past week, with a few hundred record high temperatures broken. That is about to change, as Mother Nature will remind the region that is still February.
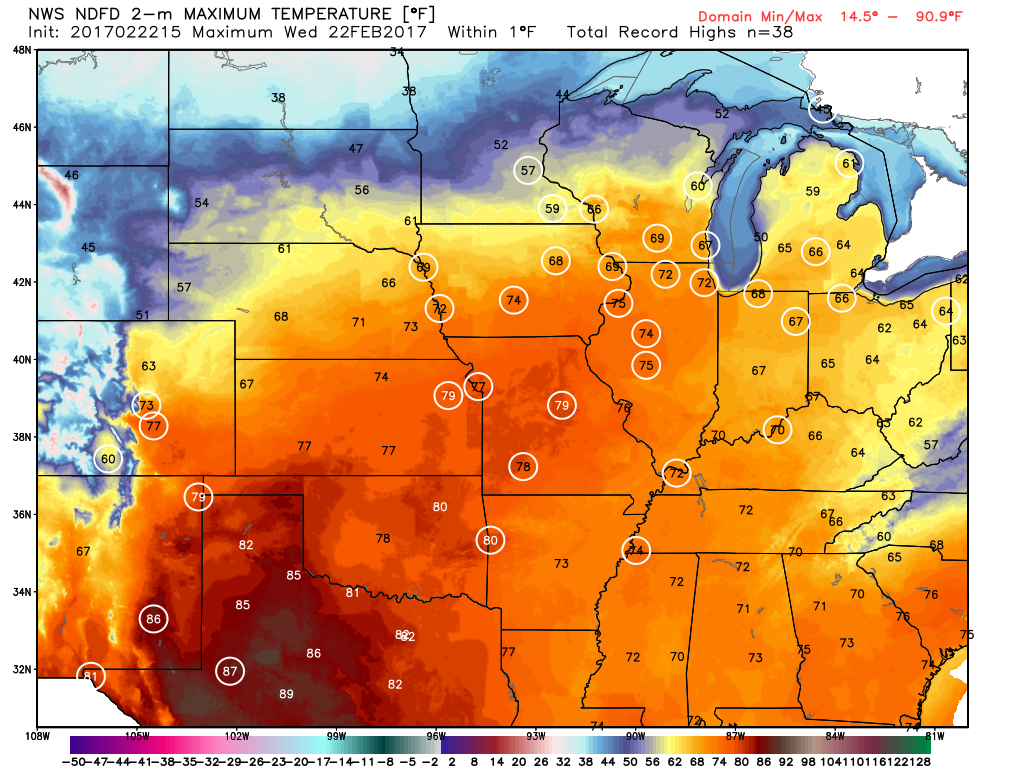
Numerous record highs are expected across the Plains and Midwest for one more day. Image provided by WeatherBell.
One more warm day is expected today, with highs well into the 60s and 70s likely setting more records. However, a cold front will sweep across the region, bringing an end to the record heat, and setting the stage for a snowstorm.
The low pressure system that brought more rain to California over the past couple of days will head eastward, bringing some snow into the Rockies today. As that system moves into the Plains on Thursday it will start to strengthen, drawing moisture northward from the Gulf of Mexico while cold air flows southward on the backside of the storm into the Northern Plains. Where these airmasses meet, snow will develop across the Central Plains states. The snow will be accompanied by winds of 20-30 mph, gusting to 40 mph or more at times, resulting in near-blizzard conditions across portions of South Dakota, Nebraska, southeastern Wyoming, and eastern Colorado on Thursday.
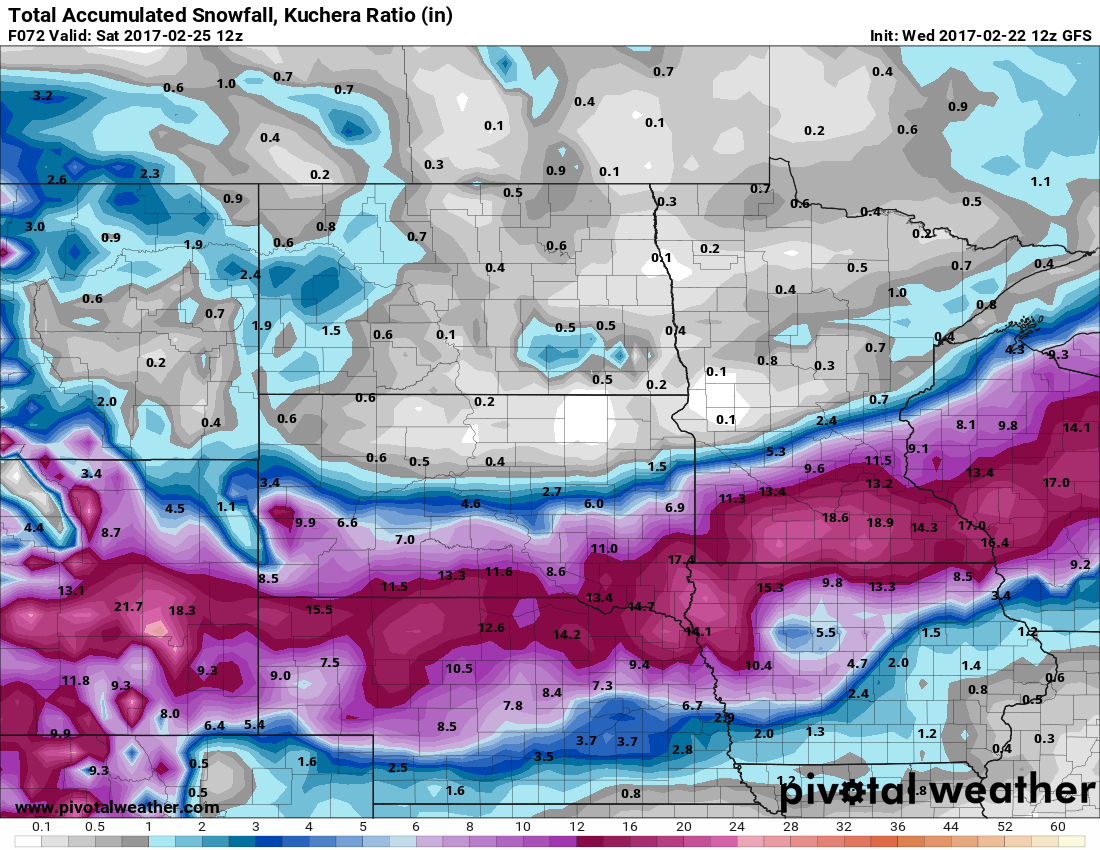
More than a foot of snow may fall in a swath from the Plains into the Upper Midwest. Image provided by Pivotal Weather.
As the system heads eastward, snow will move into portions of the Mississippi Valley and the Upper Midwest on Friday. The heaviest snow looks to stay just south of the Twin Cities, but even there, moderate to heavy snow is likely. By the time the storm moves out on Saturday, a foot or more of snow is possible in a swath from the Central Plains into the Great Lakes.
Snow isn’t the only threat from this system. As the storm moves eastward, record warmth will remain in place across the Midwest. With warm, moist air in place and a strong cold front approaching from the West, strong to severe thunderstorms are possible across portions of the Lower Great Lakes and Ohio Valley on Friday. Some of the stronger storms that form may contain damaging winds, hail, and possibly tornadoes.
The Storm Prediction Center has already highlighted the Midwest as an area to watch for severe weather on Friday. Image provided by NOAA.
The system will continue to move eastward, bringing some rain to the East Coast on Saturday, but amounts should be fairly light, and additional severe weather is not anticipated.
A developing storm system will bring heavy snow to parts of the Southeast and New England this weekend, while the West Coast braces for a lot of much-needed rainfall.
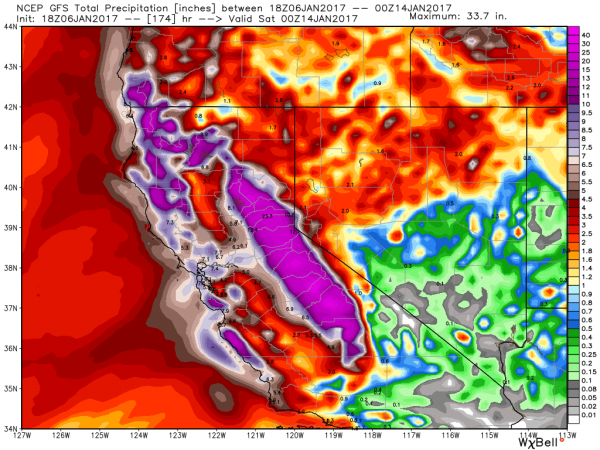
GFS Model forecast for rainfall through next Friday evening. Image provided by WeatherBell.
We’ll start on the West Coast, where a series of storm systems will bring plenty of rain to drought-stricken California. While this will not alleviate the drought that has been ongoing for years, it will help to put a big dent into it. The first of the storm systems will move in tonight, and by the time the last one moves through next Friday, rainfall totals of 5-10 inches will be widespread across much of central and Northern California, with many locations, especially along the coast and western slopes of mountains receiving 10-20 inches or more.
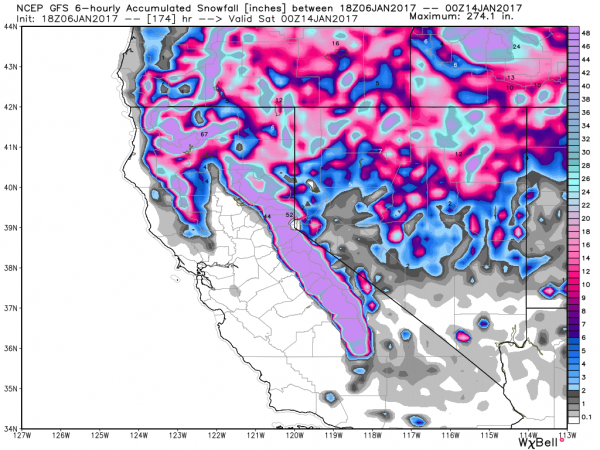
GFS Model forecast for snowfall through next Friday evening. Image provided by WeatherBell.
At the higher elevations, especially in the Sierra Nevada, incredible amounts of snow are expected. The snowpack, which much of the region depends on for water in the summer as it melts, is already above normal, and over the next week, some locations might see 6-12 FEET of new snow from these storm systems.
A variety of precipitation is falling across the Southeast this evening. Loop provided by Weathertap
Back in the East, a storm system is riding along a stalled out front across the Southeast, producing some snow across parts of the Tennessee Valley and the Southeast. As this system draws in moisture from the Gulf of Mexico and the Atlantic, and runs into an arctic airmass already settling into the region, it will produce heavy snow in places that normally don’t see a lot of snow, such as Georgia, the Carolinas, and the Virginia Tidewater area. In these places, even a dusting of snow can cause traffic nightmares, so heavy snow can bring these areas to a standstill.
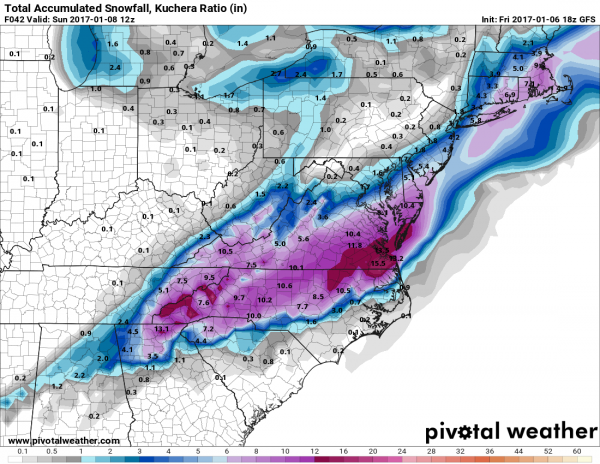
GFS model forecast for snow across parts of the Southeast and Mid-Atlantic states through Sunday morning. Image provided by Pivotal Weather.
The heaviest snow from this system is expected across the Appalachians and also across the Virginia Tidewater area, as the storm gathers strength while moving into the Atlantic. Of course, the 6-12 inches expected across much of North Carolina will cause its own problems, but luckily, the bulk of the snow will fall tonight and Saturday, minimizing the travel problems. The heaviest snow should remain just south and east of the big cities of Washington, Philadelphia, and New York, but a few inches may fall in each location.
Once this storm moves off the Mid-Atlantic coast it will head northeastward, passing a couple of hundred miles south and east of Cape Cod. Normally, this would mean just a little bit of light snow for parts of Southern New England, and for the most part, that’s what we’re expecting. However, for southeastern New England, mainly south and east of I-95, it’ll be a different story from Saturday afternoon into Sunday morning.
There are a couple of factors that will enhance snowfall totals across this region. First, with northeasterly winds blowing off the Atlantic, we’ll get some ocean-effect snowfall. This is similar to the lake-effect snow that you often see near the Great Lakes. Second, temperatures will only be in the upper teens to middle 20s. This means that it will be more of a fluffy snow, which will pile up quicker than a much wetter snow.
NAM Model forecast for snowfall through Sunday morning. Image provided by Earl Barker’s Weather Models.
The snow should start to develop across Cape Cod and southeastern Massachusetts Saturday morning, and will quickly spread inland. The snow should spread as far inland as central Massachusetts and southern New Hampshire, but it will quickly retreat eastward again, ending in most places during the evening. The exception is Cape Cod and coastal Massachusetts, where northerly winds behind the storm may keep the ocean-effect snow going into the early hours of Sunday morning.
For snowfall totals, we’re not expecting more than an inch or two from southern New Hampshire into Central Massachusetts. Points north and west of Boston and Providence, including the Merrimack Valley, will likely see 2-4 inches, with some heavier amounts across Cape Ann. Along and south of Interstate 95, including the southern and eastern suburbs of Providence and Boston, totals of 6-12 inches seem likely, with the best chance for more than a foot of snow across parts of Plymouth County and Cape Cod, where the ocean enhancement will play a big role.
Behind the system, with fresh snow cover, temperatures will turn colder. Monday morning, temperatures will be in the single numbers across much of the region, with some sub-zero readings likely. The next storm moves in later on Tuesday, and although it will start as some snow or a wintry mix, milder air will move in, with the bulk of the precipitation falling in the form of rain Tuesday night into Wednesday.
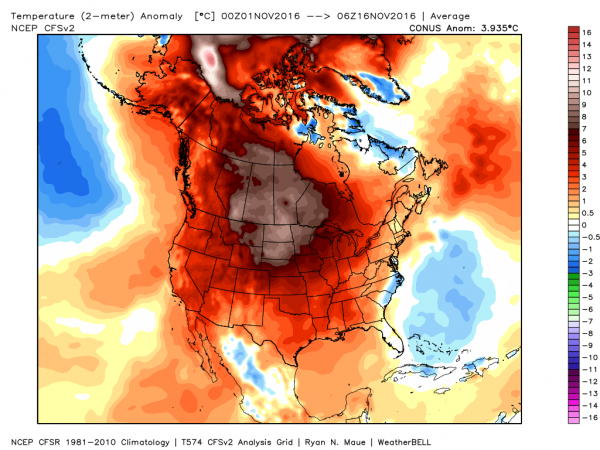
Even though we’re into the middle of November, it hasn’t felt like late autumn across much of the nation. That’s about to change, especially across the Plains states and the Midwest.
Temperatures have been as much as 10-15 degrees above normal this month across the Northern Plains. Image provided by WeatherBell.
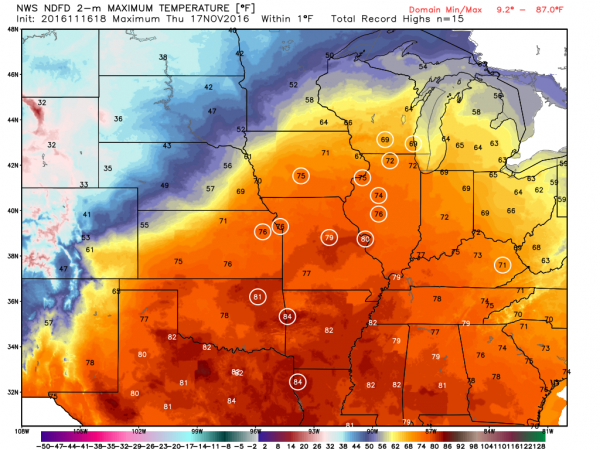
A storm system will move out of the Rockies and across the Plains states over the next few days. Ahead of the system, warm, moist air will be drawn northward from the Gulf of Mexico. High temperatures on Thursday will be in the 70s as far north as Iowa and Illinois, with record high temperatures expected across much of the Mississippi Valley. The warmth won’t last too much longer though, as a strong cold front will be marching eastward across the Great Plains.
Numerous record high temperatures are expected on Thursday across the Mississippi Valley. Image provided by WeatherBell.
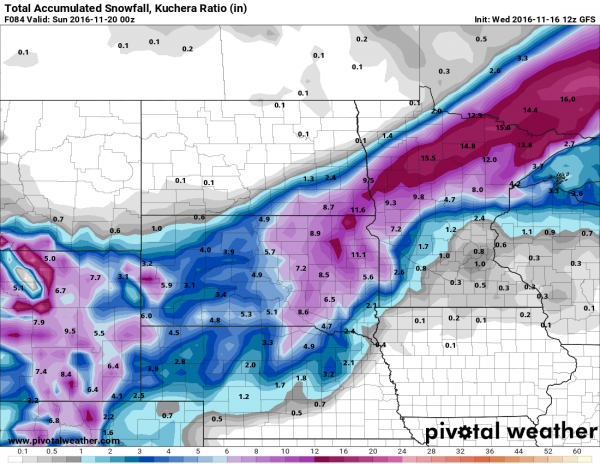
Behind the front, much cooler air will settle southward from Canada. With plenty of moisture being drawn northward, it will fall as snow on the backside of the low from the Central Rockies and Central Plains northeastward into the Upper Midwest. Some of the snow could be heavy, especially in parts of South Dakota and Minnesota, where snowfall totals of 10-15 inches are possible by Saturday evening. Winter Storm Watches have been posted from eastern Wyoming and northern Nebraska northeastward to Minnesota.
Snowfall forecast through Saturday evening from the GFS model. Image provided by Pivotal Weather.
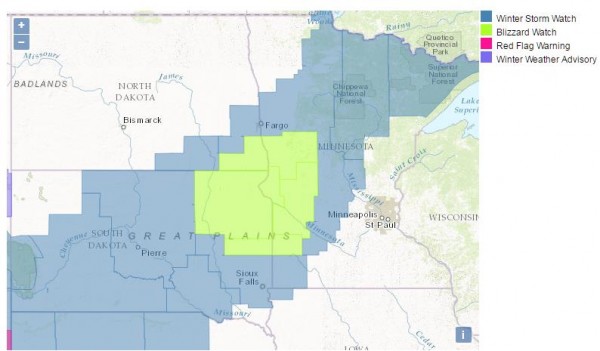
Snow isn’t the only hazard with this system. As it strengthens, it will create strong winds across much of the Plains states. Sustained winds of 20-30 mph with gusts to 50 mph or more are expected, especially from the Dakotas into Nebraska. The combination of high winds and snow may result in blizzard conditions at times. A blizzard watch has been issued for southwestern Minnesota, northeastern South Dakota, and extreme southeastern North Dakota.
Current watches and warnings across parts of the Plains States. Image provided by NOAA.
Once the system moves into southern Canada this weekend, some of the coldest air so far this season will settle into the region. While these temperatures aren’t that unusual for late November, they will be quite a change from the recent warmth that has enveloped the area. Low temperatures will likely drop into the teens and 20s across the region this weekend, with single digits possible. In some of the locations with fresh snowcover some sub-zero readings are possible. The cool air will be short-lived, as temperatures will likely warm back up to above normal readings by early next week. Current indications are that the unseasonably mild weather will persist for the most part well into December across the region.
October can be a time of change in the Northeast. While the first thing that comes to mind is the changing colors of the foliage across the region, the weather also changes, sometimes quite frequently. That’s what we’re going to be dealing with for the next few days.
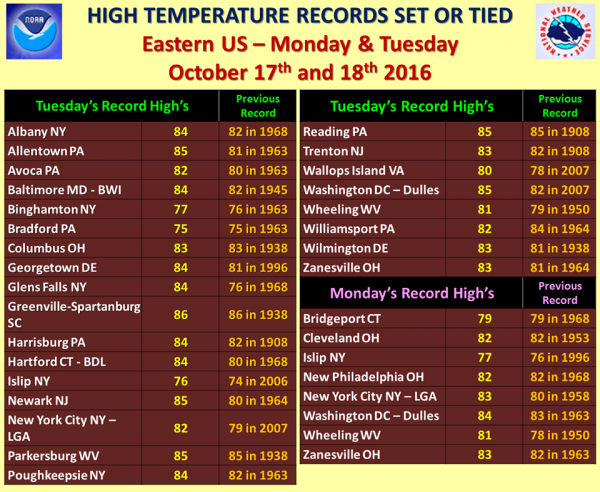
Unseasonably warm weather was observed across much of the Northeast for the past few days, with high temperatures soaring well into the 70s and 80s across much of the region. This resulted in dozens of record high temperatures. However, some changes are coming, and the warm weather will be a distant memory within the next 24-48 hours.
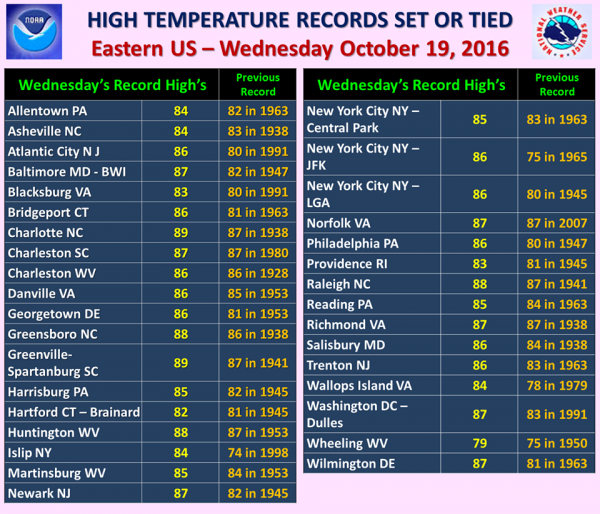
Record high temperatures broken across the Northeast on Monday October 17 and Tuesday October 18. Image provided by NOAA.Record high temperatures broken across the Northeast on Wednesday October 19. Image provided by NOAA.
A cold front moved across the region on Wednesday with little fanfare. That front will stall out to the south of New England overnight. On Thursday, a wave of low pressure will start to approach from the west. This will spread rain and showers into the area. Some of the rain will be heavy, especially from New York into Pennsylvania late Thursday into Friday. With rainfall totals of 1-3 inches and locally up to 5 inches expected, some flooding is likely. Across New England, where a serious drought is ongoing, rainfall will be much lighter, with most locations likely receiving under half an inch of rain.
Expected rainfall through Friday evening across the Northeast. Image provided by Pivotal Weather.
As that wave of low pressure moves into Upstate New York on Friday, it will lift that cold front northward across the region as a warm front once again. While Friday won’t be as warm as the past few days, high temperatures will still get into the 60s and lower 70s. With dewpoints also in the 60s, it will be a rather muggy day for mid-October.
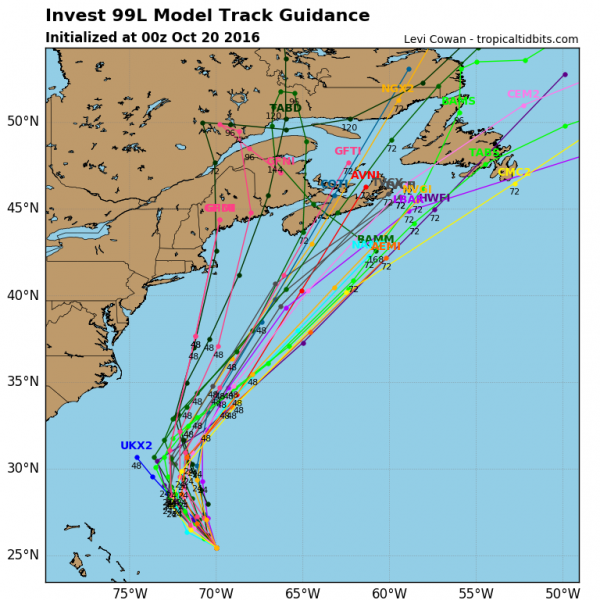
Computer model forecasts for the track of a tropical disturbance in the Bahamas. Image provided by Tropical Tidbits.
Meanwhile, there is a tropical disturbance brewing near the Bahamas. Upper-level conditions are somewhat favorable for development, and the system could become a tropical depression or subtropical storm on Thursday. The system will likely head northward, moving towards the Gulf of Maine and merging with the cold front approaching from the west as we head into the weekend. This will bring another round of heavy rainfall into Maine and Atlantic Canada, areas that were hit hard by heavy rain from Hurricane Nicole just a week ago.
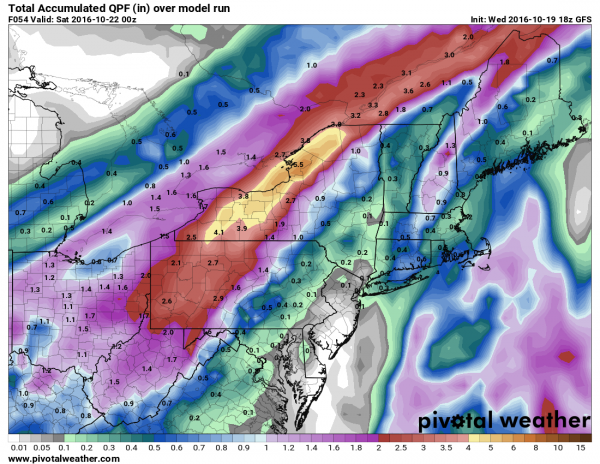
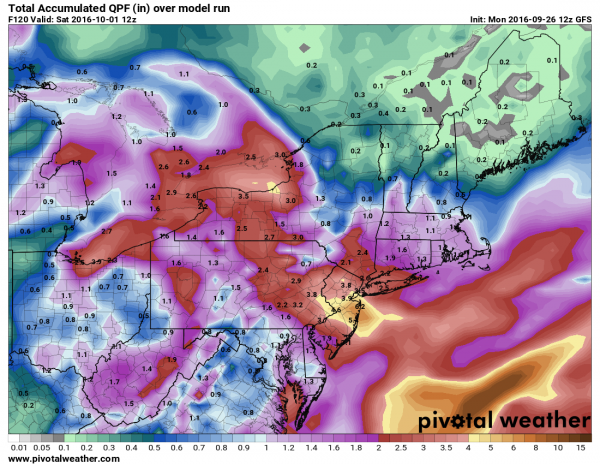
Expected rainfall between Friday evening and Sunday evening across the Northeast. Image provided by Pivotal Weather.
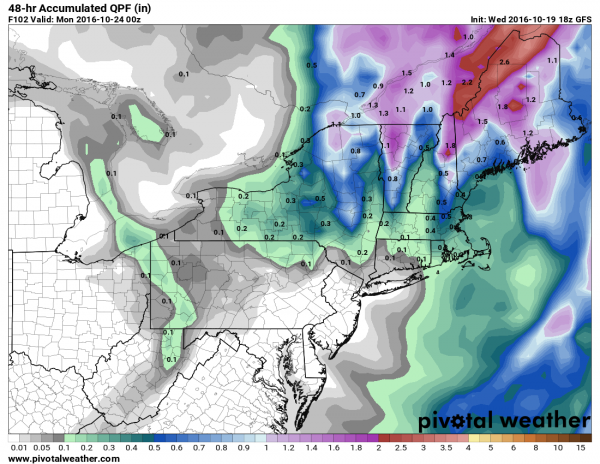
Once the system moves into southeastern Canada, it is expected to stall out under an upper-level low pressure area and become a strong extratropical system. It will drag a cold front across the Northeast, bringing much colder air into the region. With strong low pressure nearby and much colder air filtering in, rain will change over to snow across portions of Upstate New York and Northern New England. While the snow will be confined mainly to the higher elevations, this is the first accumulating snow of the season across the area. Several inches may accumulate across parts of the Adirondacks and the Green Mountains.
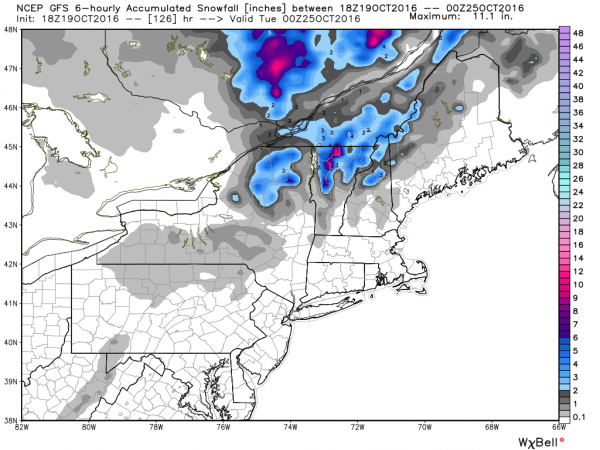
Expected snowfall through Monday evening across the Northeast. Image provided by WeatherBell.
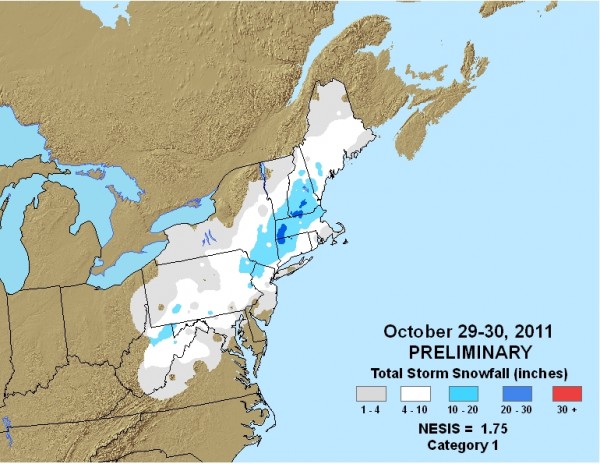
While there could be a few wet flakes mixed in with some of the rain across lower elevations of Central New England, accumulating snow is not expected.Sunday will be a chilly day, with highs only in the 40s and 50s across much of the Northeast. These readings are 10-20 degrees below normal. Of course, any mention of snow in October across the Northeast will make residents think back just a few years to the pre-Halloween snowstorm that dropped 1-2 feet of snow across parts of the region, setting numerous records. While this system won’t come anywhere close to that, it should make for some spectacular photos of snow-capped mountains and valleys filled with colorful foliage early next week.
Snowfall from the Halloween snowstorm of 2011. Image provided by NOAA.
The other thing the storm will do and bring gusty winds to much of the Northeast through the weekend. Northwest winds of 15-25 mph may gust to 40 mph at times, especially across New England. This may result in some spotty wind damage across parts of the area. The other effect it will have is to create rather chilly conditions. Just a few days as experiencing temperatures in the 60s, 70s, and 80s, highs will only be in the 40s and 50s across much of the area, with wind chills in the 30s and 40s. This is the type of change that October is known for across the Northeast.
Across much of the West, the bulk of the rainfall that falls during the year usually falls between October and April. This year is starting off right on schedule as a storm system is poised to bring heavy rain to parts of the region over the next few days.
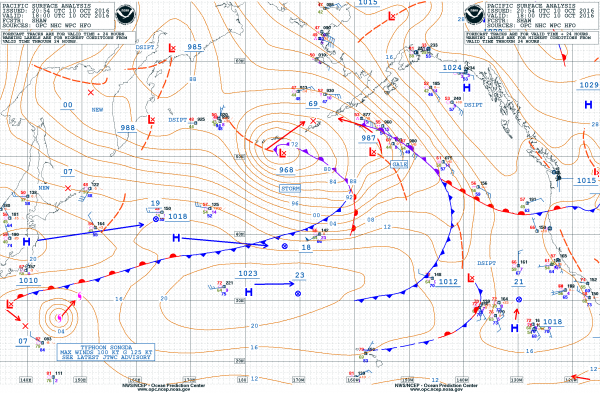
Surface analysis across the Pacific Ocean from Monday afternoon October 10. Image provided by NOAA.
A strong low-pressure system passing south of the Aleutians on Monday will move into the Gulf of Alaska over the next 24-48 hours, before heading towards British Columbia and the Pacific Northwest. The storm will bring heavy rainfall and strong winds to the Aleutians and portions of southern Alaska through midweek. Along the coast, wind gusts may reach hurricane force. With the slow movement of the storm, and the strong onshore winds, heavy rain is likely across much of the Aleutians, with totals in excess of five inches possible.
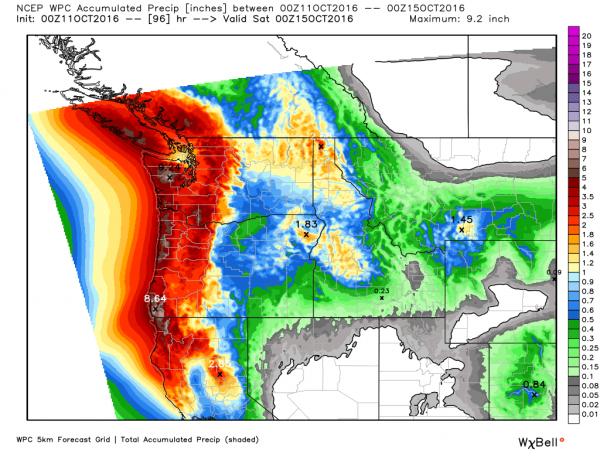
Expected rainfall across the Pacific Northwest through Friday evening. Image provided by WeatherBell.
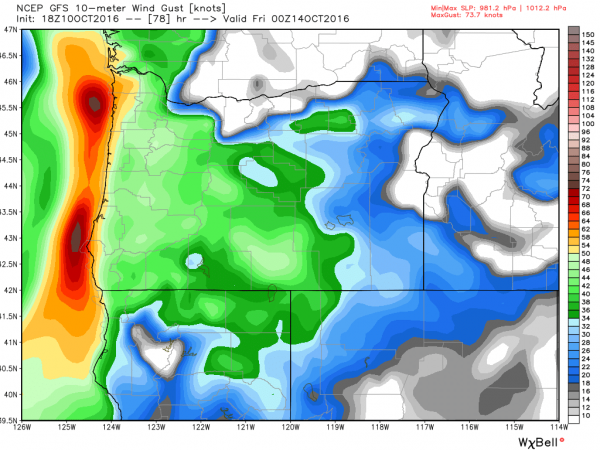
By midweek, as the storm moves towards the coast of British Columbia and Washington, rain will move into the Northwest. The heaviest rain is expected during Thursday and Friday, with several inches likely west of the Cascades, especially along the west slopes of the coastal mountains. This will likely lead to flooding in some areas. In addition to the rain, strong winds will blast the coastline. Wind gusts of 60-80 mph are possible, especially along the coast of Oregon.
GFS model forecast for peak wind gusts along the coast of Oregon Thursday afternoon. Image provided by WeatherBell.
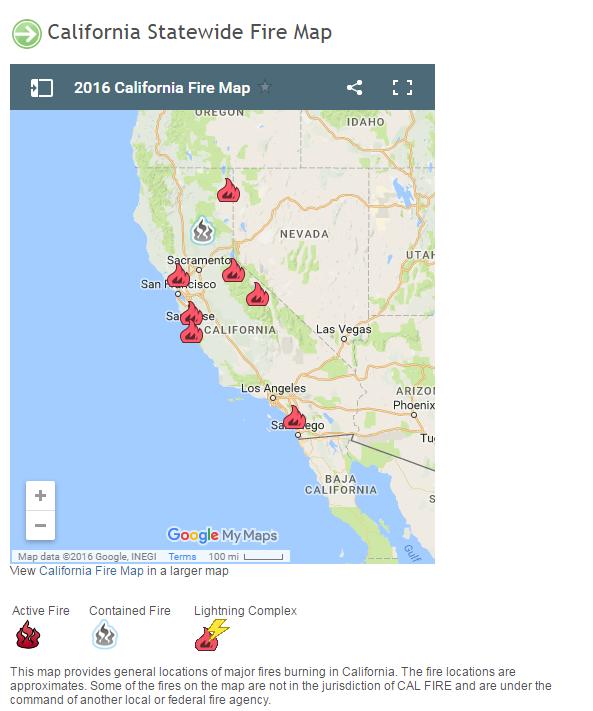
As the system pushes inland, rain will spread southward into northern California by late Thursday, likely reaching as far south as central California. This will bring beneficial rain into portions of the region, including the Bay Area, where several wildfires continue to burn. After a dry summer, this rain will be very helpful to firefighting efforts across the area. Rainfall totals of 1-3 inches are possible, with heavier amounts along the northwestern coast of the Golden State.
Active wildfires across California as of Monday afternoon October 10. Image provided by California Department of Forestry and Fire Protection.
As the rainfall moves inland, it will change to snow across the higher elevations of the Sierra Nevada. Snow levels will remain fairly high with this system, likely around 7000 feet. Above that, especially above 9000 feet, snowfall totals of 8 to 16 inches are possible. While this is not the first snow of the season in the Sierras, it is the first significant storm of the season.
Once this system pushes inland, another strong storm looks to follow on its heels. Another round of strong winds and heavy rain is expected to move into the Northwest and Northern California for the weekend. That storm may be the remnants of Typhoon Songda, currently passing out to sea and weakening south and east of Japan.
Winters in the Northeast can be often feel long and cold, leaving residents of the region longing for sunny, warm days in the Spring and Summer. This year, they got quite a lot of them, which didn’t draw too many complaints. However, because it was so sunny and warm, much of the region is now in the midst of a very serious drought.
Latest drought update that shows more than two-thirds of the Northeast experiencing some form of drought. Image provided by the National Drought Monitor
A persistent ridge of high pressure kept the Northeast dry and warm through much of the Spring and Summer. Most of the cold fronts that tried to move through the region were starved for moisture, thus their main effects were to cool temperatures and lower humidity for a day or two. Thunderstorm activity was common, but aside from localized downpours, there really hasn’t been a widespread heavy rain event across much of the region for several months. That could be changing this week.
A slow-moving cold front will move across the region on Tuesday, bringing showers with it. While the rain likely won’t be too heavy, it should be widespread, which is good news for an area that needs all the rain it can get. The front will likely stall out right along the coastal plain, which may keep the shower activity going into Wednesday right along the coast. However, changes in the weather pattern are coming that promise to bring even more rain to the area.
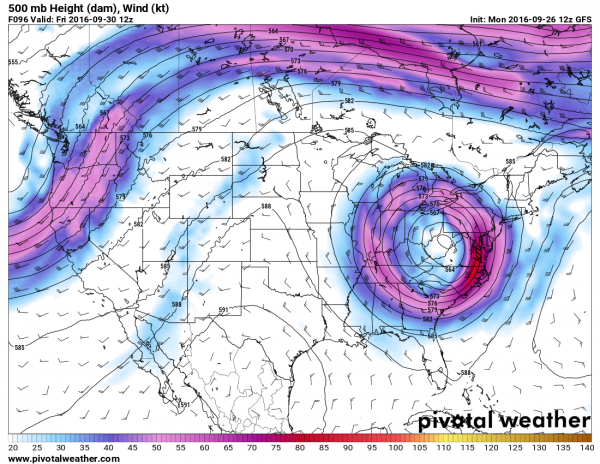
GFS forecast showing an upper-level low pressure area sitting over the Appalachians Friday morning. Image provided by Pivotal Weather.
An upper-level low pressure system will drop southward from the Great Lakes and take up residence across portions of the Ohio Valley and Appalachians. It will likely stay there for several days, before lifting out to the northeast this weekend. However, with the upper-level low pressure area just sitting there, low pressure will essentially remain in place at the surface as well across the same area. This will result in periods of rain and showers across much of the area right through the week. While the rain may be briefly heavy at times, persistent rainfall over several days can add up, with some areas possibly receiving 1-3 inches of rain between Tuesday and Friday, with some heavier amounts possible. Rainfall deficits in this area are on the order of 5-10 inches, so much more is needed, but this is definitely a good start.
GFS model forecast for rainfall through Saturday morning. Image provided by Pivotal Weather.
Of course, this beneficial rain may not impact the entire Northeast. For New England, the forecast is much trickier. With the low setting up well to the southwest of the area, high pressure will try to build in from the north. This will bring cool and dry conditions into much of northern New England this week. As for southern New England, where the effects of the drought are the most pronounced, the forecast depends entirely on where the low and high set themselves up. If the high is the dominant feature, much of southern New England can expect dry and cool conditions, with gusty east to northeasterly winds bringing some clouds and drizzle in off the Atlantic at times. If the low sets up a bit closer to the region, then the forecast will trend more towards a damp scenario with periods of showers for the next several days. At this point, it’s still a little too early to tell which scenario will be the correct one.
Astronomical fall begins on September 22 at 10:21am EDT, but meteorological fall is defined as the period between September 1 through November 30. While it can and does still feel like summer across parts of the nation, there are more and more signs that summer is winding down.
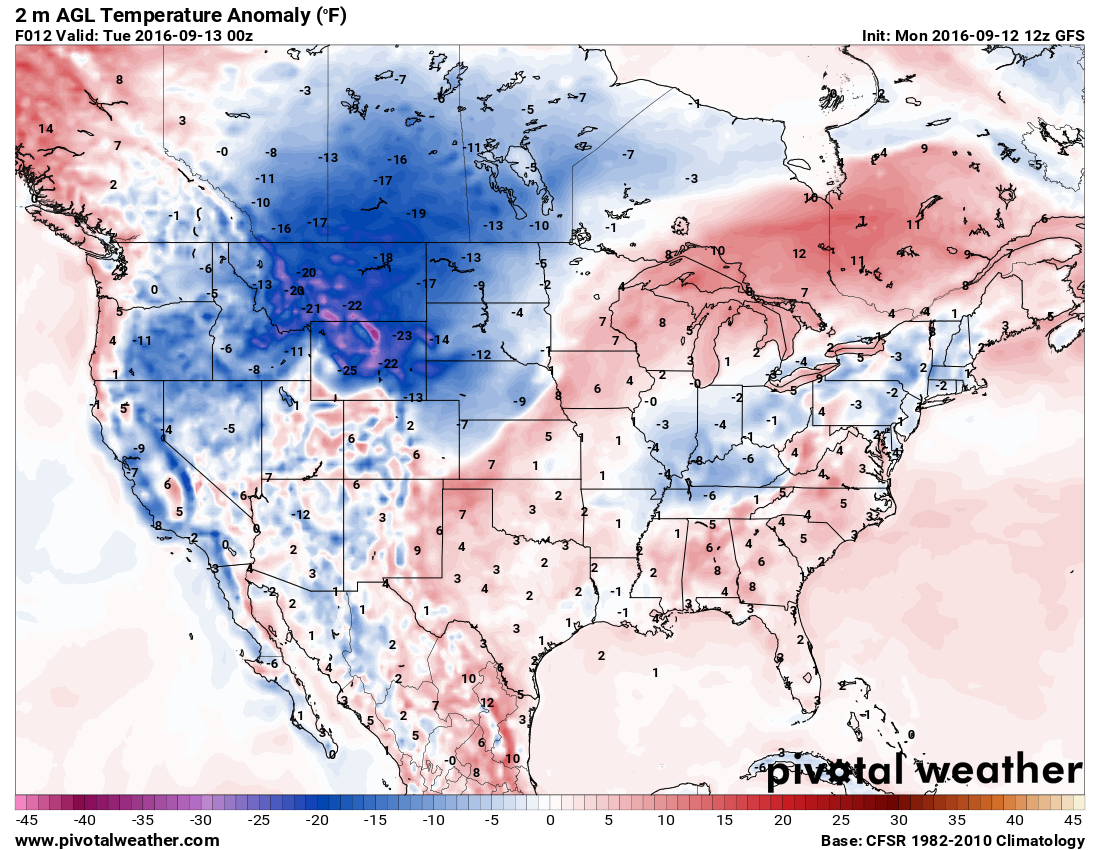
As the nights start to grow a little longer the farther north you go, the cooler air starts to build up a little more, especially as you head into Canada and Alaska. The cold fronts that drop down from Canada and into the Northern US start to pack a little more punch. One of those fronts is moving across portions of the Upper Midwest and the Great Plains today. The airmass moving into the Rockies and Northern Plains behind the front is sending temperatures as much as 15 to 25 degrees below normal this afternoon.
Temperatures will be 15 to 25 degrees below normal across the Northern Rockies and Northern Plains today behind a cold front. Image provided by Pivotal Weather.
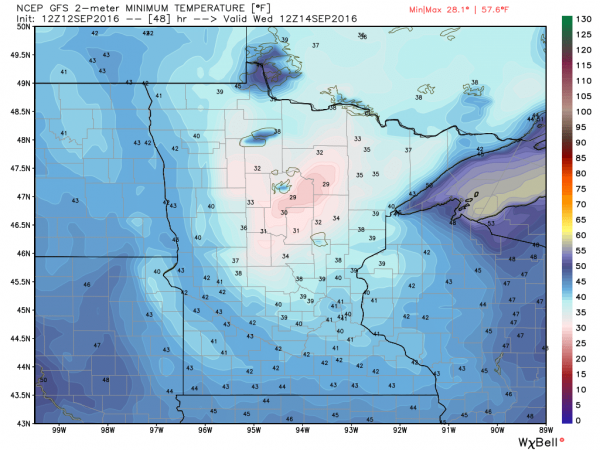
As that airmass settles in, low temperatures will drop into the 30s and 40s across the Northern Plains and Rockies tonight. Frost advisories and freeze warnings have been posted for western portions of North Dakota for Tuesday morning. By Wednesday morning, the coldest air will move over Minnesota, where low temperatures could drop into the upper 20s and 30s. Additional frost and freeze advisories will likely be issued for this region.
GFS model forecast for low temperatures across Minnesota Wednesday morning. Image provided by WeatherBell.
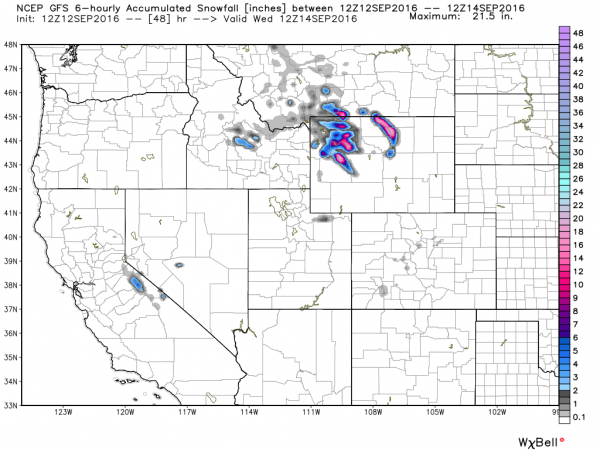
Cold temperatures aren’t the only noteworthy item with this cold front. As the cold air surges into the Rockies, precipitation will accompany it. That precipitation will likely fall as snow in many areas, mainly at elevations above 5000 feet. Across some of the higher peaks, more than a foot of snow could accumulate over the next day or two. Winter Weather Advisories have been issued for portions of northern Wyoming as a result.
GFS model forecast for snowfall through Wednesday morning. Image provided by WeatherBell.
Some snow is also possible across the higher elevations of the Sierra Nevada as the cooler air spreads into the West. While accumulations will be minor, this will likely be the first snowfall of the year for this region. Across the rest of the Golden State, temperatures will likely be 6 to 12 degrees below normal on Tuesday, with highs only in the 70s to lower 80s, a welcome change from the 90s and 100s they’ve had for most of the summer.
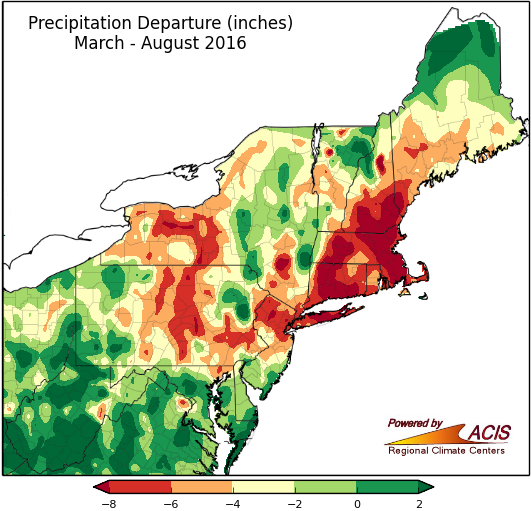
While this front will bring cooler air into the Northeast later this week, one thing it won’t do unfortunately, is bring beneficial rainfall to the region. It will produce showers and some thunderstorms, and while a few of the storms may contain heavy downpours, they’ll be very localized. Across much of the region, rainfall totals will be generally under half an inch. This will do little to put a dent in the severe drought that much of the region is currently experiencing. Rainfall deficits of 5 to 10 inches below normal since the beginning of March are common across the region.
Rainfall deficits across the Northeast from March 1 through August 31. Image provided by the Northeast Regional Climate Center.
While this early taste of fall moving into much of the Northern US this week is not uncommon for mid-September, it might not be repeated much this fall. Long-range forecasts are showing the likelihood of a warmer than normal fall across much of the United States.
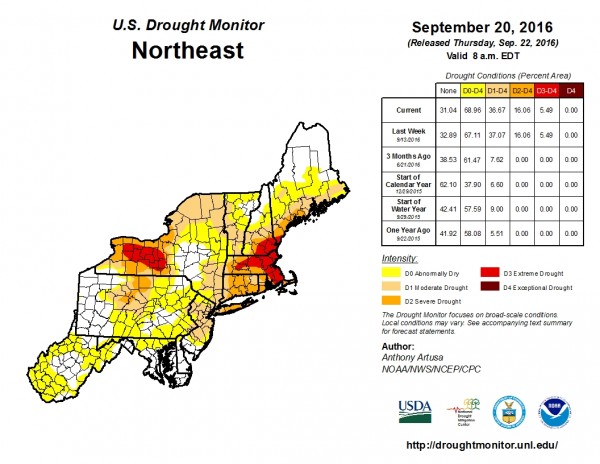
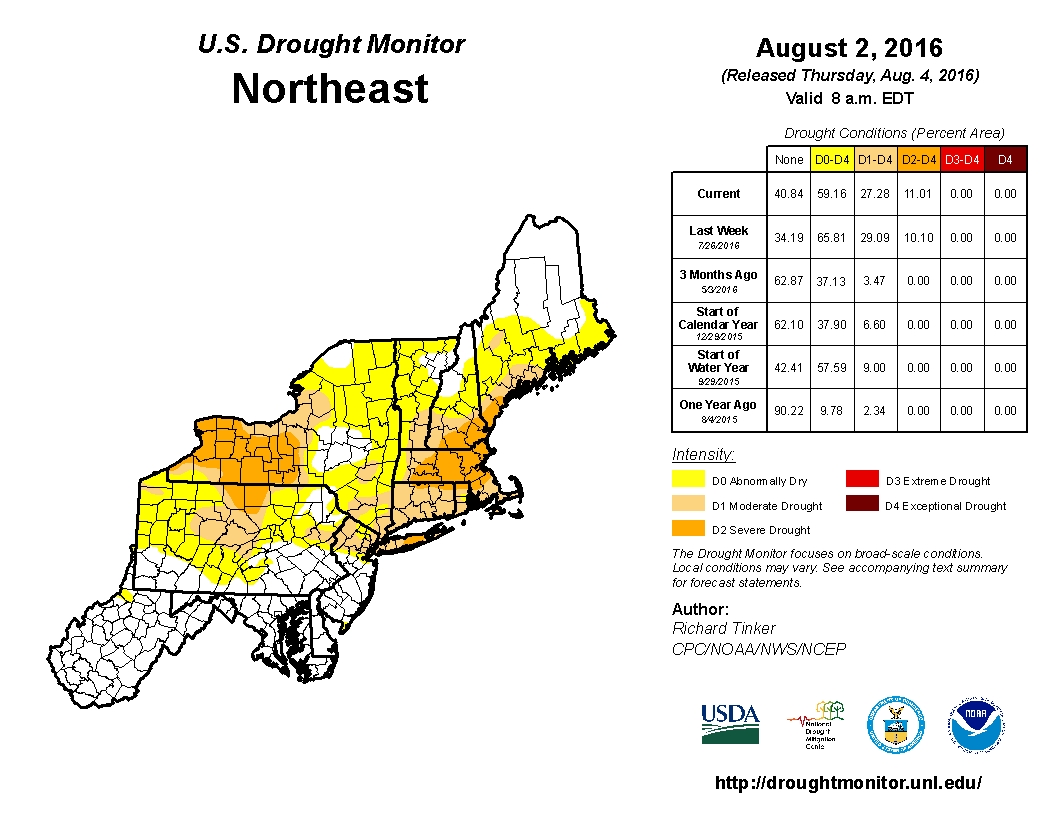
A persistent pattern over the last several months has left much of Northeast in a drought. According to the most recent update from the National Drought Monitor, portions of Western New York and also Central New England are experiencing severe drought.
Update from August 2 on drought conditions across the Northeast, Image provided by NOAA.
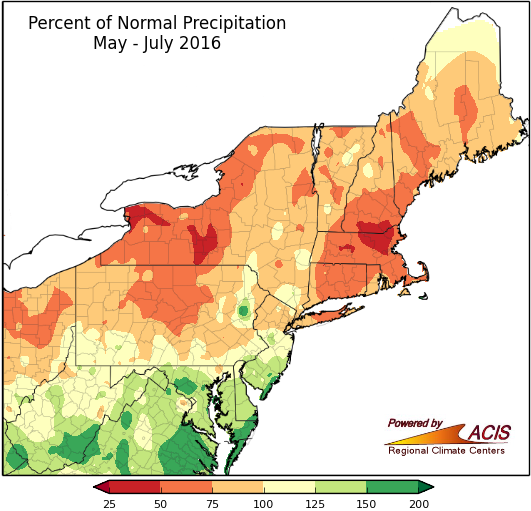
Heavy showers and thunderstorms have been common across the Mid-Atlantic states recently, eliminating any drought concerns, but the bulk of the rainfall has remained well south or well north of areas that need it the most.
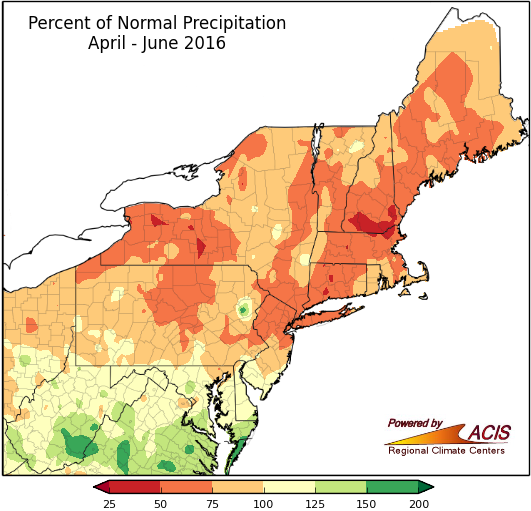
Map showing percent of normal rainfall from May 1 through July 31 across the Northeast. Image provided by the Northeast Regional Climate Center
According to data from the Northeast Regional Climate Center, the period between Marc 1 and August 2 is the driest on record for several locations across New York and New England, including cities such as Lawrence, MA, and Elmira and Batavia, NY. Other locations, such as Hartford, CT and Hingham, MA, are in the Top 5 driest March 1-August 2 on record. Many rivers and streams across the region are at near record low levels. Water restrictions and/or bans are in effect for hundreds of cities and towns across the region.
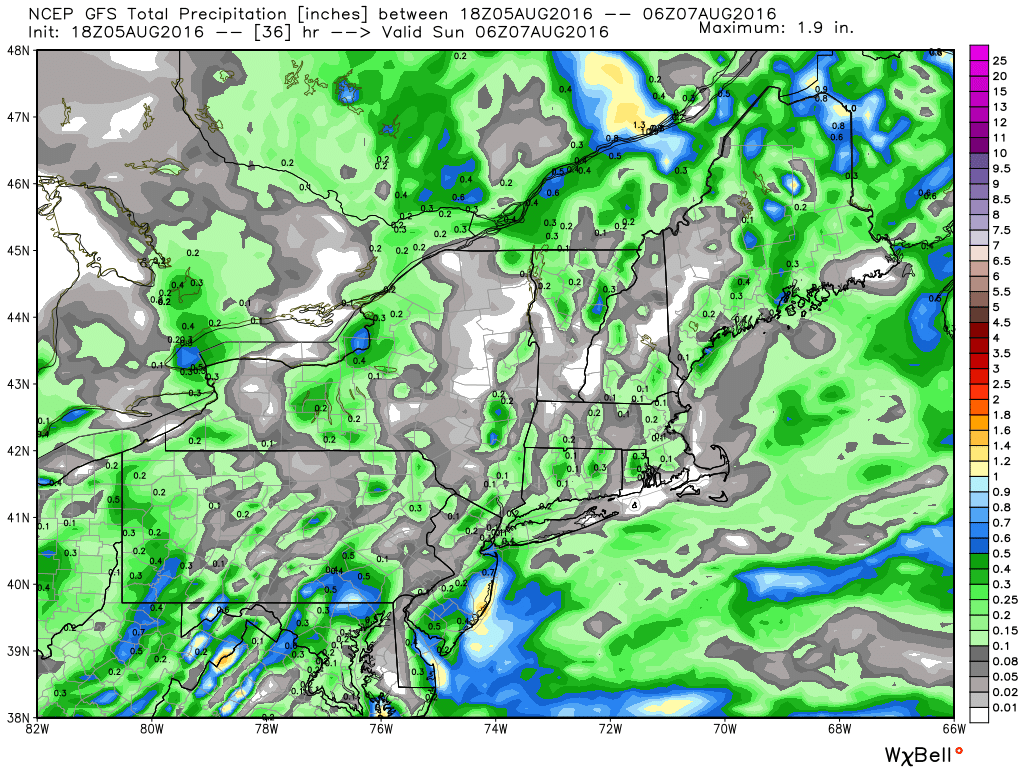
A cold front will cross the region on Saturday, producing scattered showers and thunderstorms. While some of these storms could be locally heavy, most places will receive just light rainfall, which will barely put a dent in the drought. The bigger concern on Saturday is for severe weather across the Northeast. While the timing of the front won’t be optimal for a severe weather outbreak, conditions will be favorable for some strong to severe thunderstorms, especially across Southern New England and southeastern New York during the afternoon hours. Some storms may produce strong winds along with hail and brief downpours.
GFS model forecast for rainfall through Saturday night. Image provided by WeatherBell.
Once the front moves through, high pressure builds back in with sunshine and dry conditions for the first half of the upcoming week. Another front will move through on Wednesday with a chance for some additional showers and thunderstorms before stalling out across the region. Exactly where that front stalls out will be critical, as waves of low pressure are expected to ride along it, bringing chances for some much-needed rainfall. If the front stalls along the southern New England coast, then some significant rainfall could fall across much of New York and Southern New England. If the front stalls out across the Mid-Atlantic states, then the heaviest rain would be focused there, and not where it is needed most. The forecast models are split on where the front will stall out, so it’s too early to get a good idea of which idea might be correct. However, if history is any indication, then expect the front to stall out to the south. Droughts feed on themselves, which leads to an old forecasting rule of thumb – “When in drought, leave it out”.
Satellite loop showing Tropical Storm Early moving into eastern Mexico and a disturbance in the northeastern Gulf of Mexico. Loop provided by NOAA.
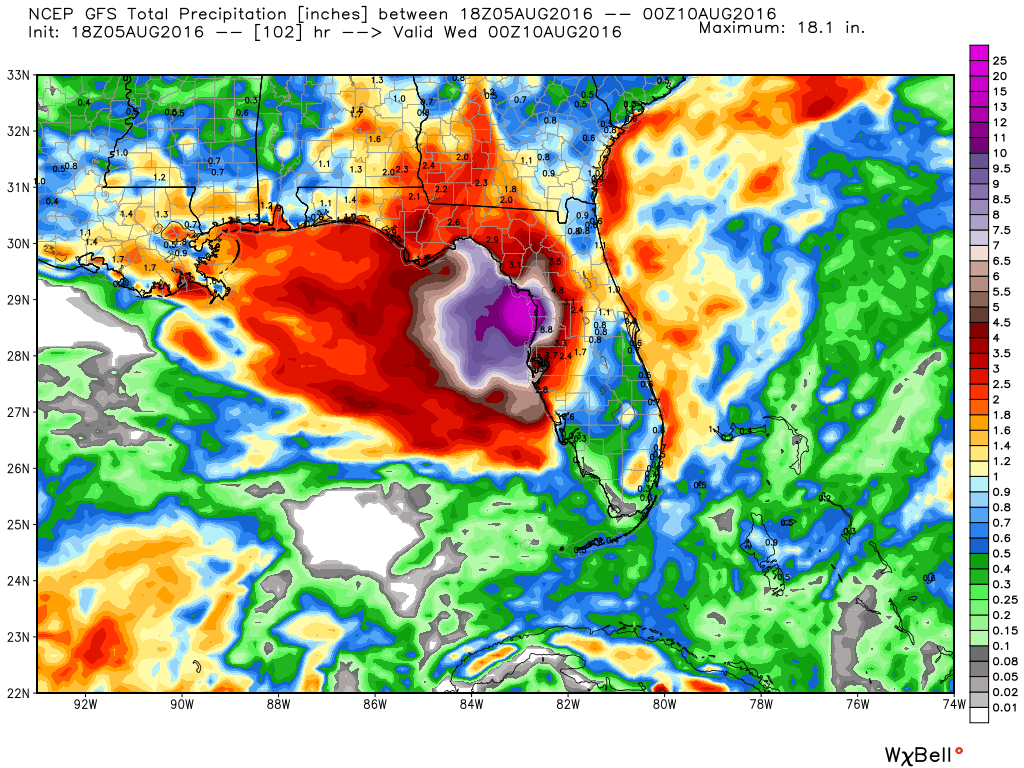
Normally, when the Northeast experiences a drought in the summer, it ends with heavy rainfall from a tropical system, or the remains of a tropical system that made landfall elsewhere. Tropical Storm Earl is moving into eastern Mexico this evening, but it is not expected to have any impacts on the US. However, there is a cluster of thunderstorms in the northeastern Gulf of Mexico that needs to be watched. While development of a tropical cyclone is not expected over the next few days, the system could slowly organize. The main impact from this system will be heavy rainfall across the Gulf Coast, especially in portions of Florida and southern Georgia. Some models are showing the potential for 5-10 inches of rain over the next few days. This will almost certainly lead to flooding in parts of the region.
GFS model forecast for rainfall across the Gulf Coast through Tuesday. Image provided by WeatherBell.
The ideal situation would be for some of this moisture to be drawn northward and ride along the front into the Northeast, finally bringing significant rainfall to the area. While this is a possibility, it does not seem like a likely scenario at this point. In fact, some of the models show the moisture remaining in place across the Northern Gulf of Mexico right through the week, with heavy rain and thunderstorms continuing across the region.
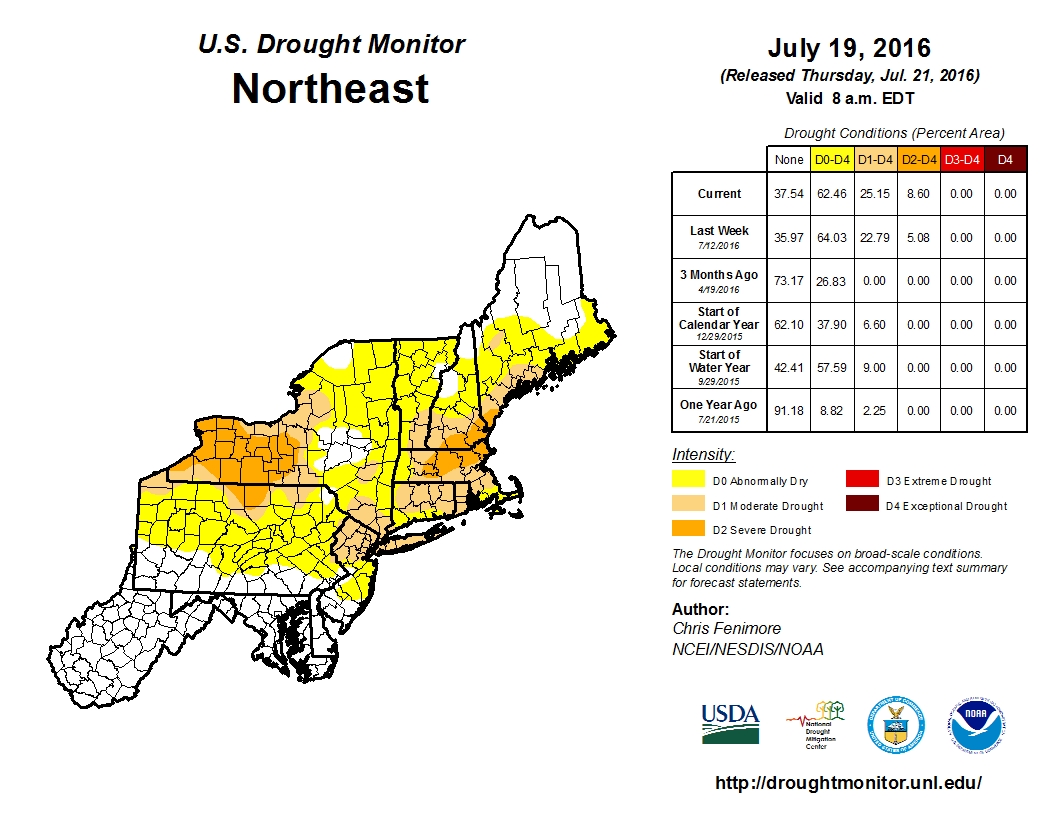
We don’t know who first coined that phrase, but like most meteorological rules of thumb, it tends to hold true most of the time. Currently in New England, especially Southern New England, a drought currently grips the region.
Latest update from the U.S. Drought Monitor.
A persistent pattern has led to warm and dry conditions across the Northeast for the past several months. While scattered showers and thunderstorms have produced locally heavy rainfall in some areas recently, widespread rainfall has been lacking. Many cold fronts have come across the region with little rainfall and coastal storms are rare in the summer to begin with. Even waves of low pressure passing south of New England along stalled out cold fronts have been too far south to produce much rain across out area.
Rainfall since the start of April has been well below normal across the Northeast. Image provided by the Northeast Regional Climate Center.
The dryness has been most noticeable since the beginning of June. Since June 1, Boston’s Logan Airport has recorded just 1.99″ of rain. This is the driest June/July on record in the city. The current record is 2.03″ from 1949. If Boston does not receive more than 0.04″ before Sunday night, a new record will be set (more on that later). In Worcester, the 3.18″ during the same timeframe is the 4th lowest total on record. In Lowell, 3.12″ of rain has been reported since June 1. This is the 8th lowest total on record.
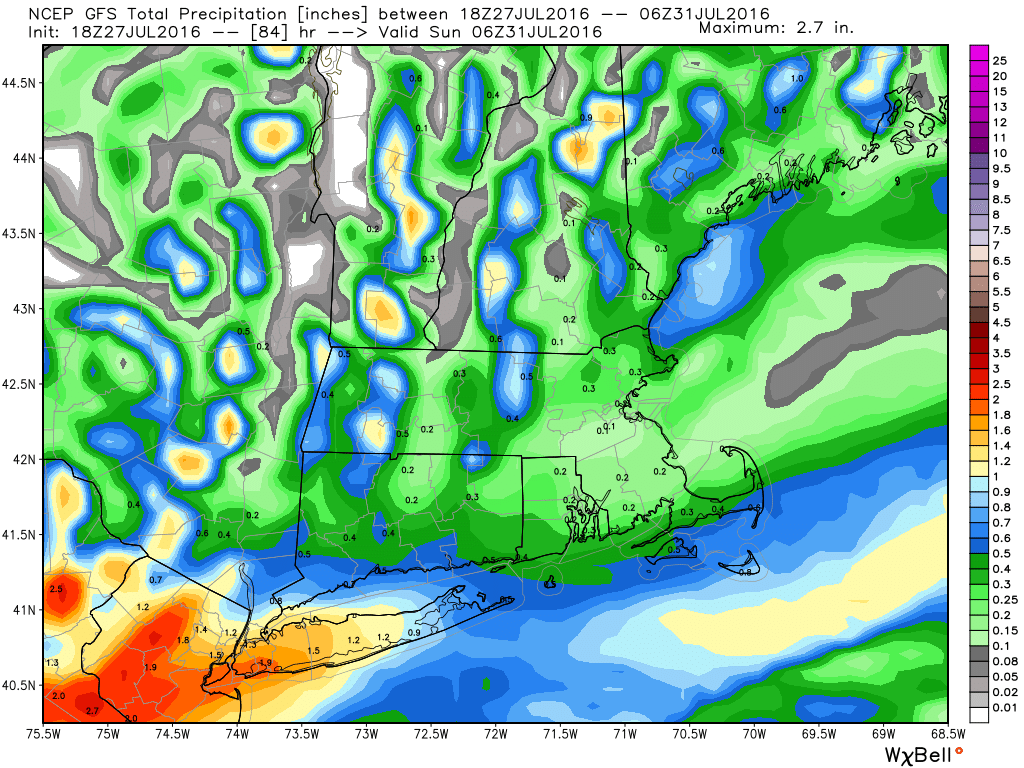
Is there any relief on the way? A cold front will move across the region late Thursday and early Friday, then stall out south of New England. A wave of low pressure will ride along the wave, passing south of us on Friday. This wave will produce locally heavy rain and thunderstorms across the Ohio and Tennessee Valleys on Thursday, before it heads for the Mid-Atlantic states Thursday night. The question then is, how far north does the low and its associated rain shield get. This is the same situation we often see in the winter when trying to determine if a storm will miss us completely, bury us with heavy snow, or come too close and give us rain instead of snow. Thankfully, we don’t have to worry about snow for another 3-4 months at least.
Right now, there are several different solutions among the models, which have a rather large impact on the forecast.
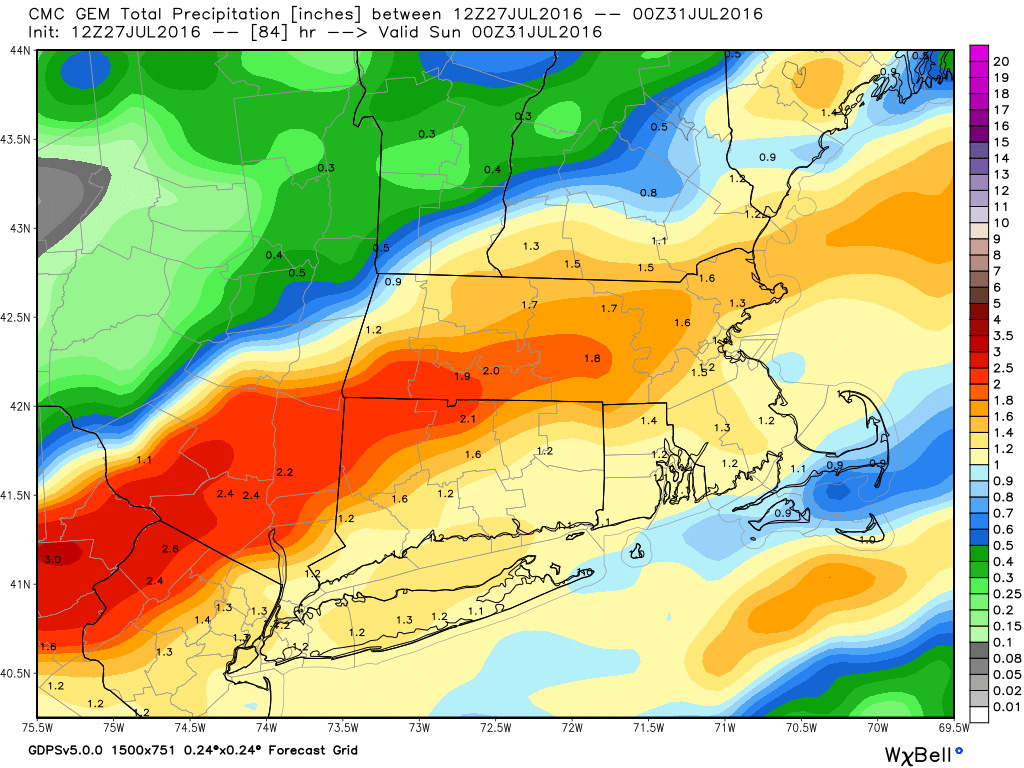
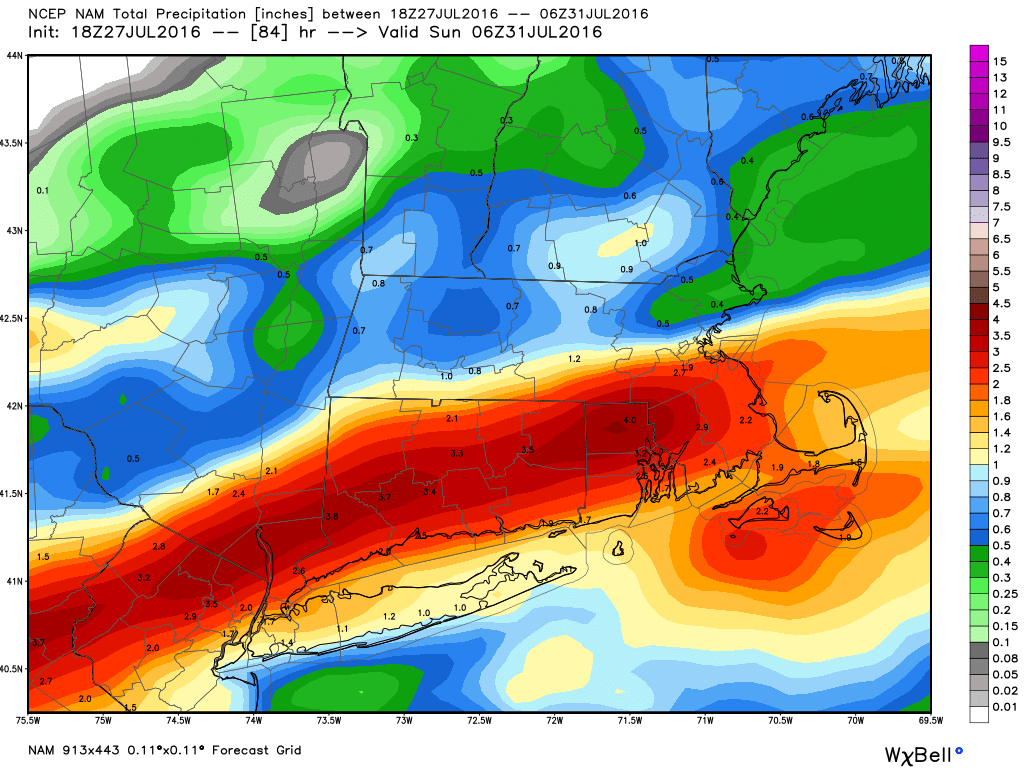
GFS model forecast for total rainfall through Saturday night. Image provided by WeatherBell.GEM model forecast for total rainfall through Saturday night. Image provided by WeatherBell.NAM model forecast for total rainfall through Saturday night. Image provided by WeatherBell.
For the past few months, as we’ve mentioned previously, most of these storms have passed too far south to have much of an impact on us. For this reason, we’re inclined to lean that way with the forecast for Friday as well. Droughts feed on themselves, which is how the expression at the top of the page came into existence. When the ground is dry, there is even less moisture available for approaching systems. When there’s less moisture available, less rain falls. When less rain falls, the drought gets worse. So how do you break a drought? When you have one in the summer, usually, the answer is with a tropical system. Either a tropical storm/hurricane comes up the coast and slams into New England dumping copious amounts of rain on us, or one hits farther down the coast (North Carolina or the Gulf) and weakens inland and the remains of it move this way with heavy rainfall. The Summer of 1955 was hot and dry like this one has been. Then, in the span of a week in August, two Tropical Storms (Connie and Diane) brought record rainfall to the region, with widespread flooding. Of course, that’s not the preferred scenario. A more gradual transition to a wetter pattern is the best case scenario, but that isn’t how is usually works.
Speaking of the tropics, things may be starting to heat up. Since a record-setting June, there hasn’t been any activity at all in the Atlantic in July, but that could be changing. A tropical wave moved off the coast of Africa on Tuesday, producing plenty of shower and thunderstorm activity. Although some of that activity diminished today, conditions are still favorable for some development over the next few days. The odds of the system becoming a tropical depression are still fairly low, and the odds of it impacting any land, let alone New England are still fairly remote.
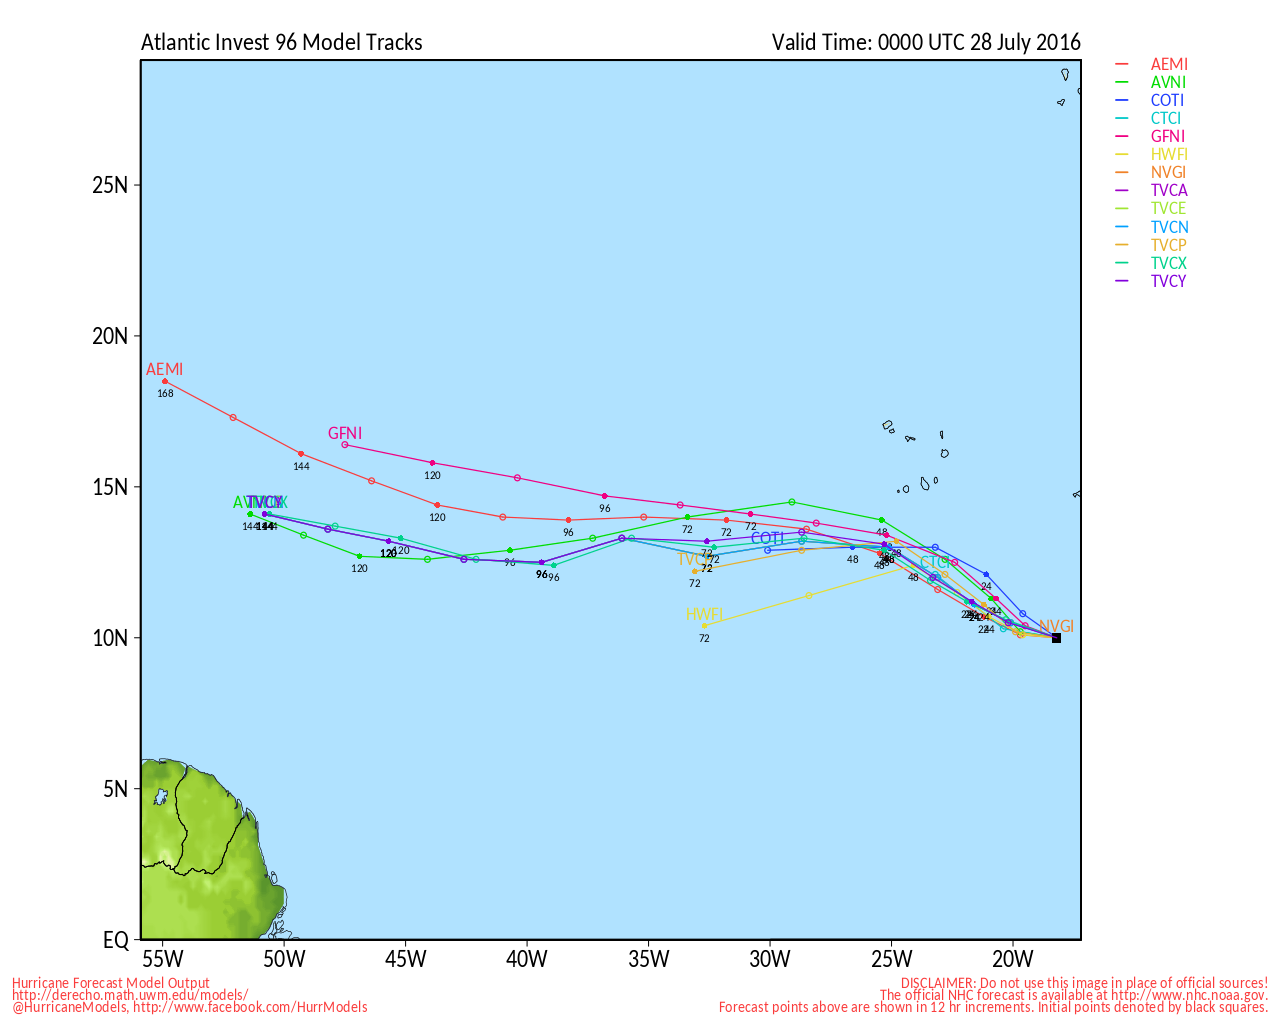
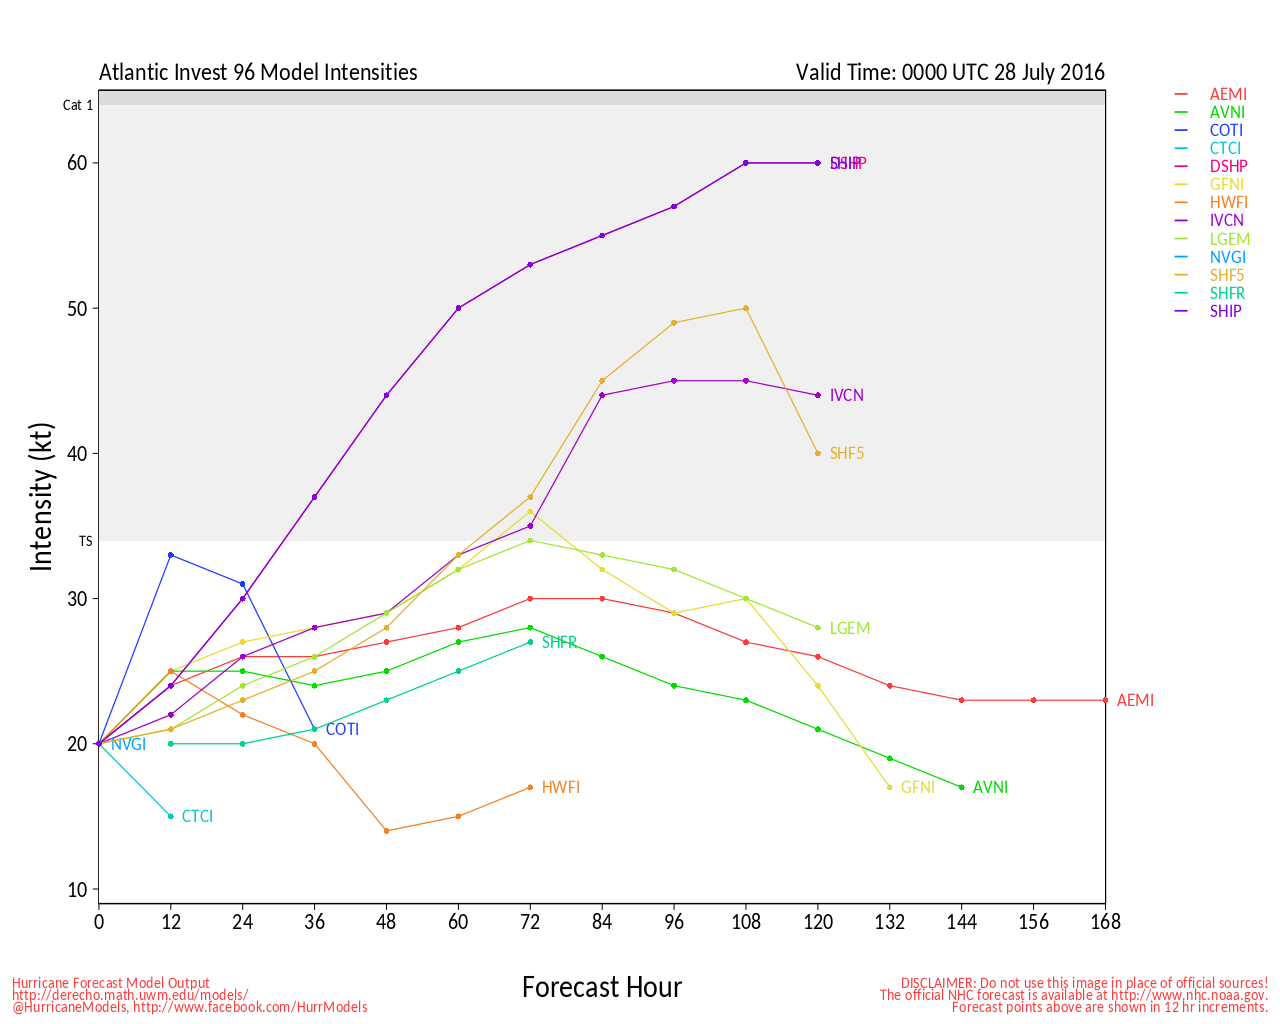
Model forecasts for the track of a tropical disturbance in the Eastern Atlantic. Image provided by the University of Wisconsin.Model forecasts for the intensity of a tropical disturbance in the Eastern Atlantic. Image provided by the University of Wisconsin.
Now that we’re approaching the beginning of August, these waves should start to move off the coast of Africa every few days. At least a few of these will eventually become tropical systems as we approach the peak of hurricane season, which is late August into late September. Another area to watch is down near the Bahamas. Sometimes tropical systems form in this region, and they can quickly strengthen and head up the coast within a couple of days, which is exactly what Hurricane Bob did in August of 1991.
A ridge of high pressure over the Plains states will slowly shift westward over the next few days, with intense heat across the Plains heading for the Desert Southwest.
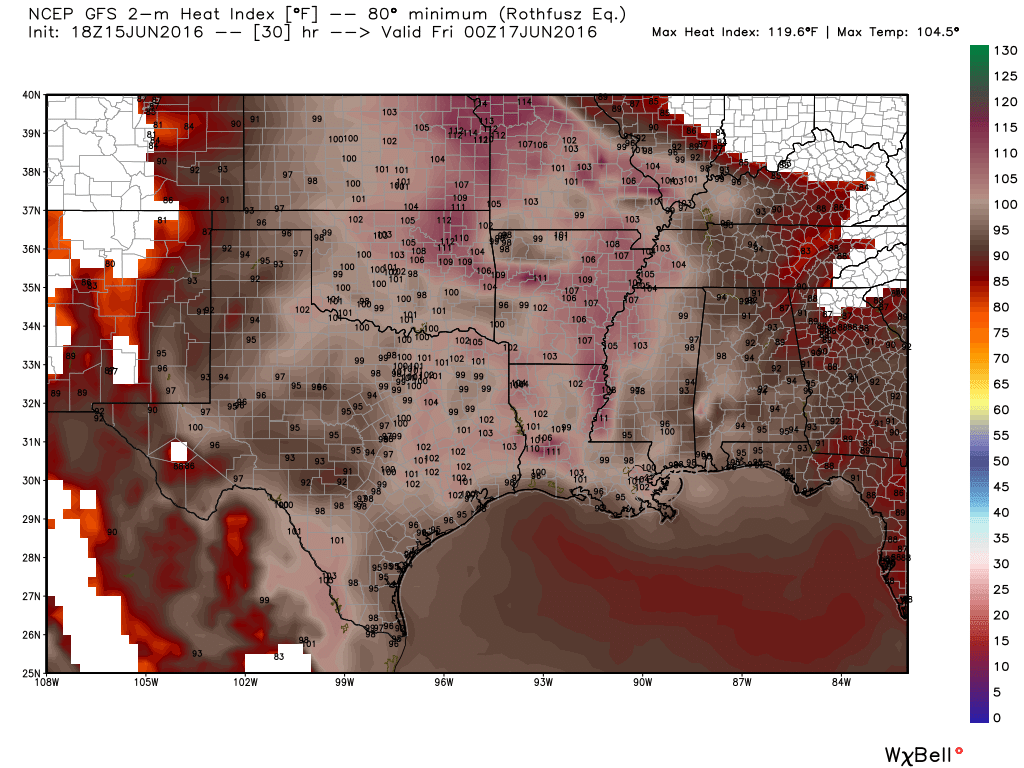
High temperatures soared well into the 90s across the Southern Plains on Wednesday, but when the humidity was factored in, the heat index exceeded 100-110 degrees in parts of the nation’s midsection. Only a few showers and thunderstorms provided scattered relief to the region. On Thursday, with similar conditions expected across much of the Southern Plains and parts of the Mississippi Valley, heat advisories have been posted for much of the region. High temperatures will be well into the 90s once again with some triple digit readings expected. When the humidity is factored in, heat index values will be in the 100-115 degree range across the region.
Forecast for heat index values for Thursday afternoon. Image provided by WeatherBell
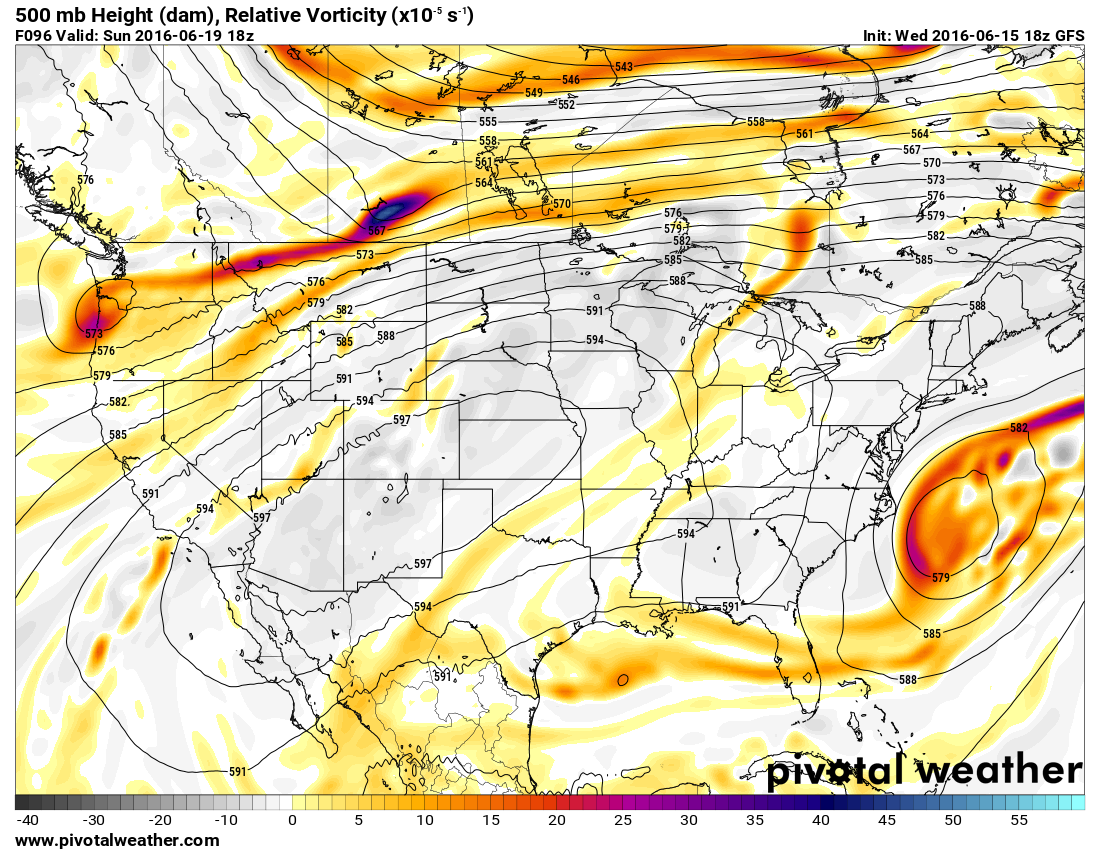
While the nation’s midsection has been enduring the heat, a trough of low pressure has been keeping the West cool for the past few days. Temperatures have been as much as 10 to 20 degrees below normal, especially across the Pacific Northwest. Across the higher elevations of the Cascades, several inches of snow has been reported.
Forecast for 500mb heights for Sunday June 19. Image provided by Pivotal Weather.
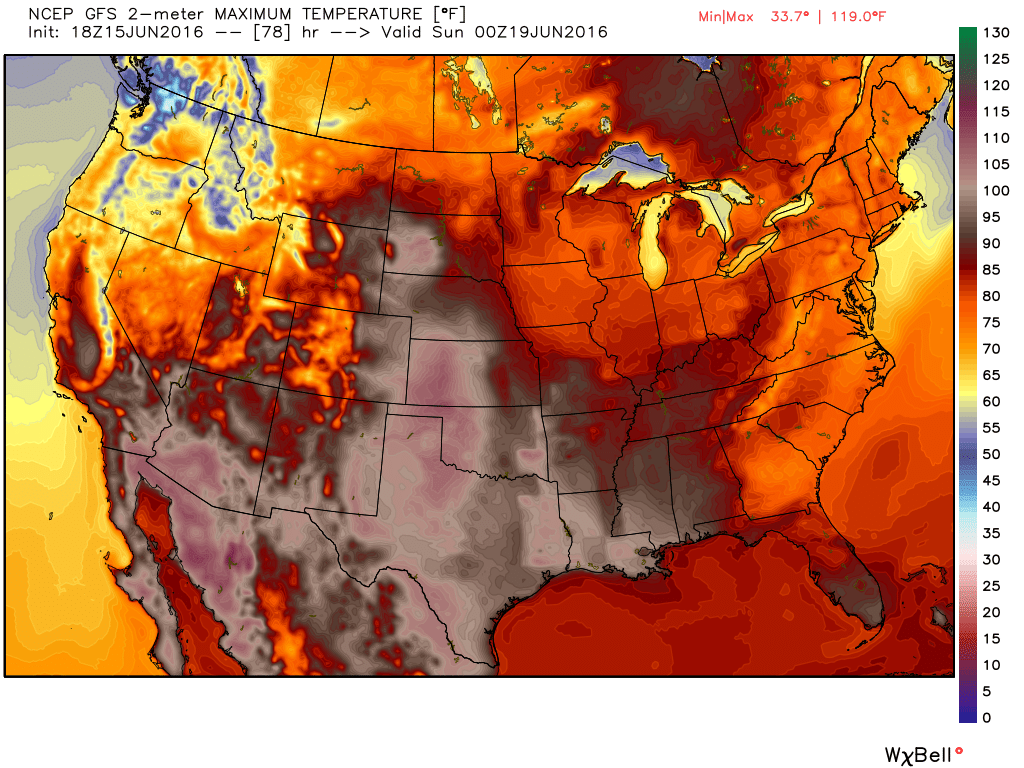
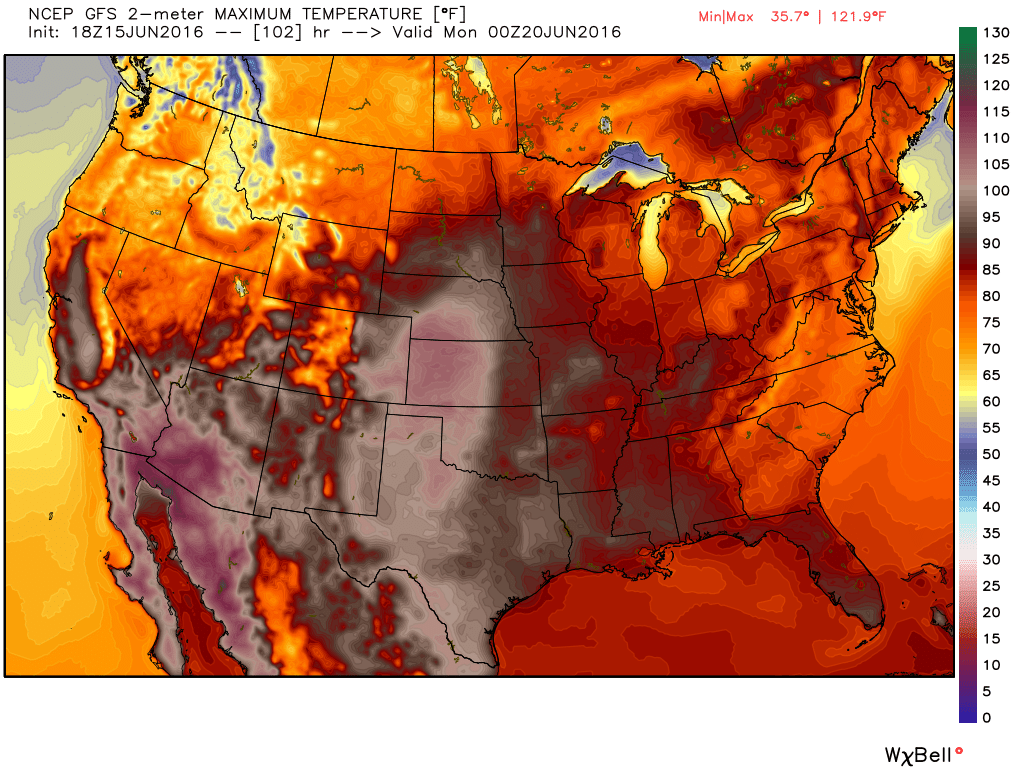
While the Northwest will remain cool into the weekend, much warmer weather will move into the Southwest as a ridge of high pressure builds westward. By Saturday, temperatures will be 10-20 degrees above normal in the Desert Southwest. For a place that is “normally” hot, anomalies that big can break records. In Phoenix, high temperatures could approach 120 degrees on Sunday. The record high for that day is 115, set in 1968.
High temperature forecast from the GFS model for Saturday June 18. Image provided by WeatherBell.High temperature forecast from the GFS model for Sunday June 19. Image provided by WeatherBell.
Excessive heat watches have been posted for much of the Southwest from Saturday through Tuesday. The hottest days look to be Sunday and Monday, when high temperatures will likely exceed 110 degrees in Las Vegas, and could approach 120 degrees in Phoenix and Yuma. In Death Valley, California, high temperatures on Sunday and Monday could approach 125 degrees.
Even at night, there will be little relief, as low temperatures may only drop into the 80s to lower 90s across the area. In Death Valley, temperatures may only drop below 100 degrees for a couple of hours.
While temperatures may drop a few degrees later in the week, the ridge of high pressure is expected to remain in place across the Southwest right through the end of the month, keep temperatures above to well above normal.