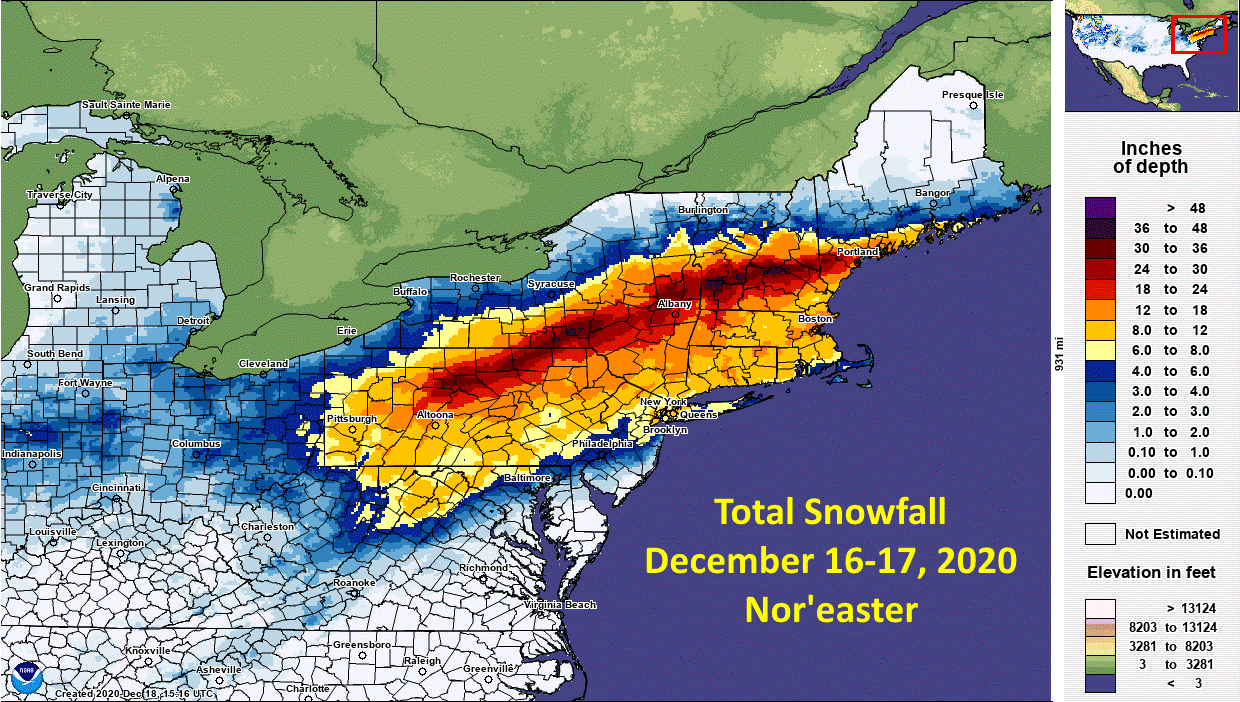
The storm that impacted much of the Northeast earlier this week had an amazing band of very heavy snow fall into arctic air.
Observers in cities and towns in PA, NY and New England:
- 19 locations reported over 40 inches
- 126 locations reported over 30 inches
- 219 reported over 24 inches
- 456 reported over 12 inches.
It is likely to make the NESIS list.
What is NESIS? NWS describes it:
While the Fujita and Saffir-Simpson Scales characterize tornadoes and hurricanes respectively, there is no widely used scale to classify snowstorms. The Northeast Snowfall Impact Scale (NESIS) developed by Paul Kocin and Louis Uccellini of the National Weather Service (Kocin and Uccellini, 2004) characterizes and ranks high-impact Northeast snowstorms. These storms have large areas of 10 inch snowfall accumulations and greater. NESIS has five categories: Extreme, Crippling, Major, Significant, and Notable.
The index differs from other meteorological indices in that it uses population information in addition to meteorological measurements. Thus NESIS gives an indication of a storm’s societal impacts. This scale was developed because of the impact Northeast snowstorms can have on the rest of the country in terms of transportation and economic impact.
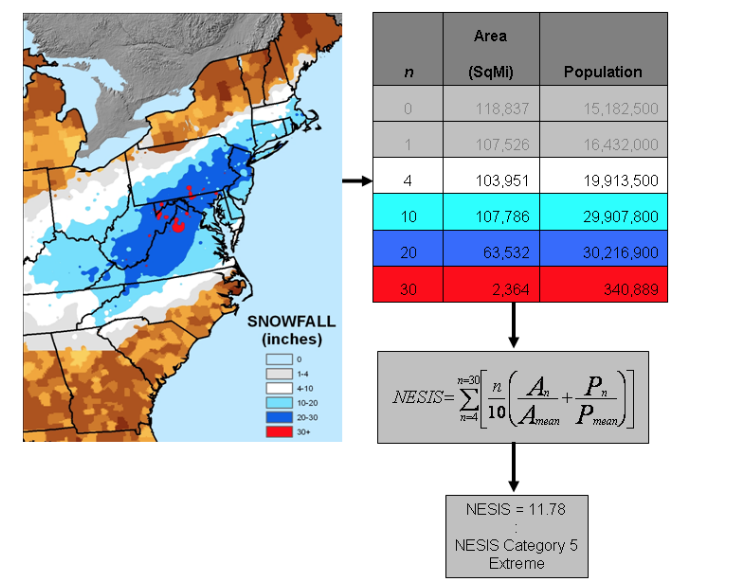
NESIS scores are a function of the area affected by the snowstorm, the amount of snow, and the number of people living in the path of the storm. The diagram below illustrates how NESIS values are calculated within a geographical information system (GIS). The aerial distribution of snowfall and population information are combined in an equation that calculates a NESIS score which varies from around one for smaller storms to over ten for extreme storms. The raw score is then converted into one of the five NESIS categories. The largest NESIS values result from storms producing heavy snowfall over large areas that include major metropolitan centers. For details on how NESIS scores are calculated at the National Centers for Environmental Information, see Squires and Lawrimore (2006).
The Northeast Snowfall Impact Scale (NESIS)
Overview
While the Fujita and Saffir-Simpson Scales characterize tornadoes and hurricanes respectively, there is no widely used scale to classify snowstorms. The Northeast Snowfall Impact Scale (NESIS) developed by Paul Kocin and Louis Uccellini of the National Weather Service (Kocin and Uccellini, 2004) characterizes and ranks high-impact Northeast snowstorms. These storms have large areas of 10 inch snowfall accumulations and greater. NESIS has five categories: Extreme, Crippling, Major, Significant, and Notable. The index differs from other meteorological indices in that it uses population information in addition to meteorological measurements. Thus NESIS gives an indication of a storm’s societal impacts. This scale was developed because of the impact Northeast snowstorms can have on the rest of the country in terms of transportation and economic impact.
NESIS scores are a function of the area affected by the snowstorm, the amount of snow, and the number of people living in the path of the storm. The diagram below illustrates how NESIS values are calculated within a geographical information system (GIS). The aerial distribution of snowfall and population information are combined in an equation that calculates a NESIS score which varies from around one for smaller storms to over ten for extreme storms. The raw score is then converted into one of the five NESIS categories. The largest NESIS values result from storms producing heavy snowfall over large areas that include major metropolitan centers. For details on how NESIS scores are calculated at the National Centers for Environmental Information, see Squires and Lawrimore (2006).
| Table 1: NESIS categories, their corresponding NESIS values, and a descriptive adjective: | ||
| CATEGORY | NESIS VALUE | DESCRIPTION |
| 1 | 1—2.499 | Notable |
| 2 | 2.5—3.99 | Significant |
| 3 | 4—5.99 | Major |
| 4 | 6—9.99 | Crippling |
| 5 | 10.0+ | Extreme |
| Table 2: Ranks 64 high-impact snowstorms that affected the Northeast urban corridor. | ||||||
| RANK | START | END | NESIS | CATEGORY | DESCRIPTION | MAP |
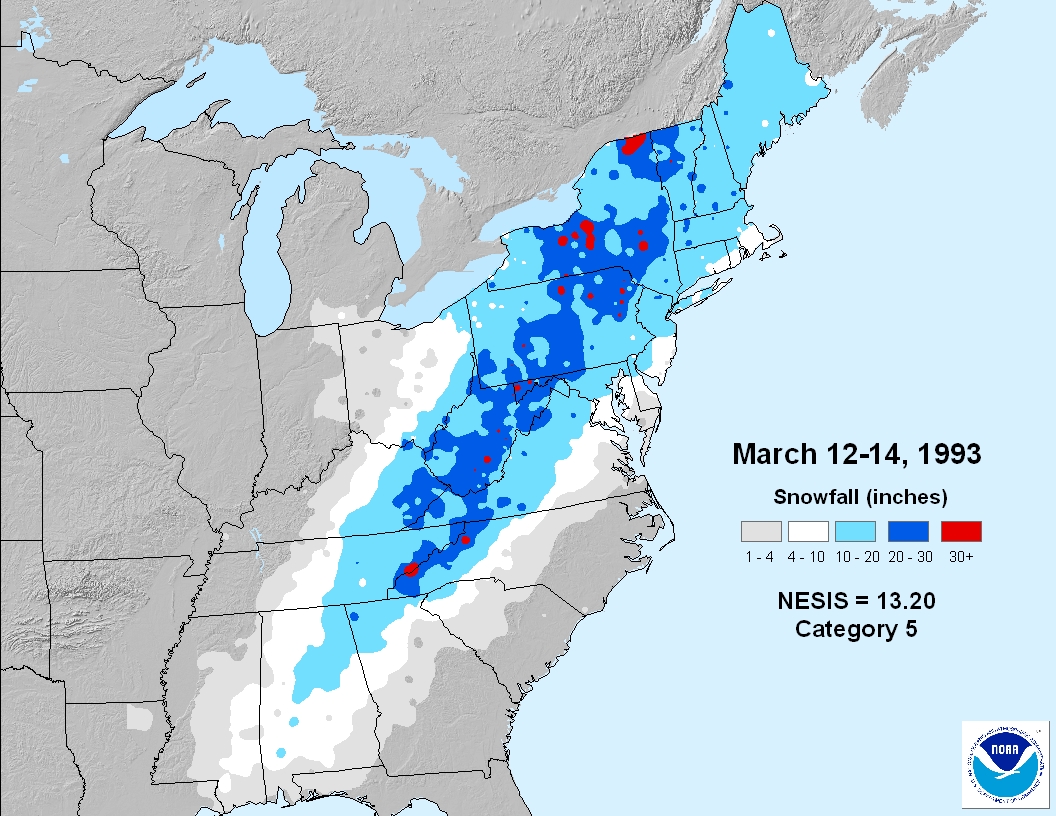
| 1 | 1993-03-12 | 1993-03-14 | 13.20 | 5 | Extreme | view |
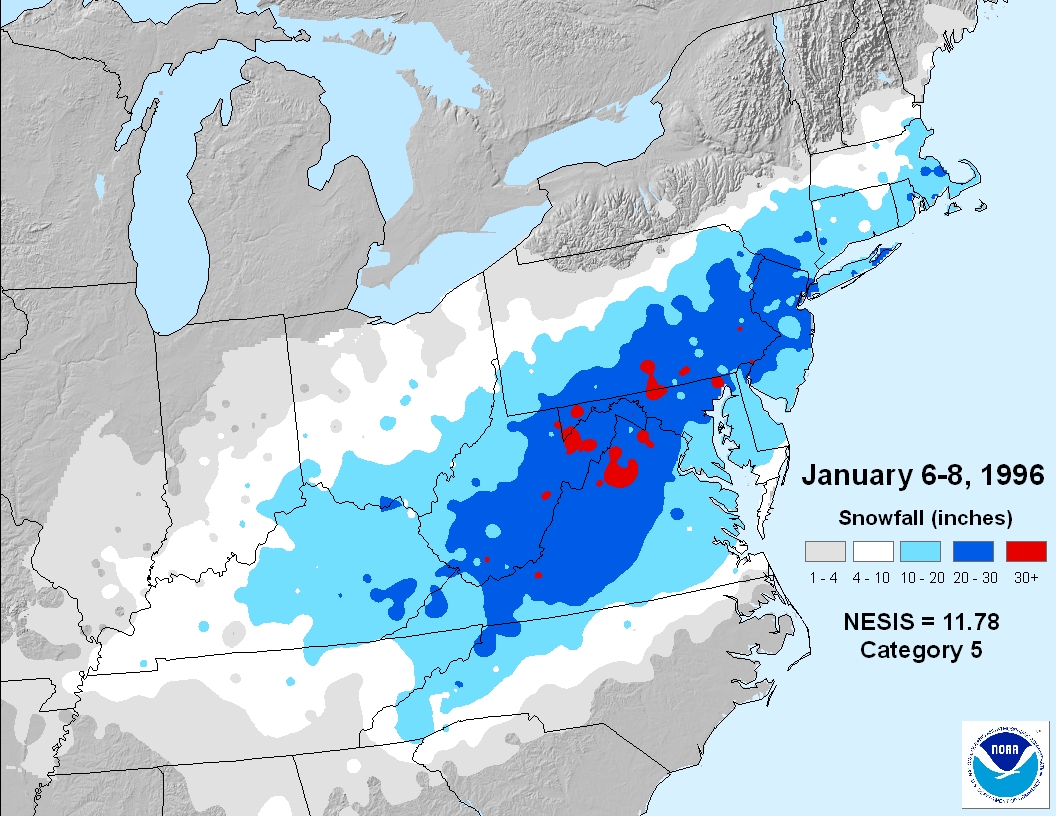
| 2 | 1996-01-06 | 1996-01-08 | 11.78 | 5 | Extreme | view |
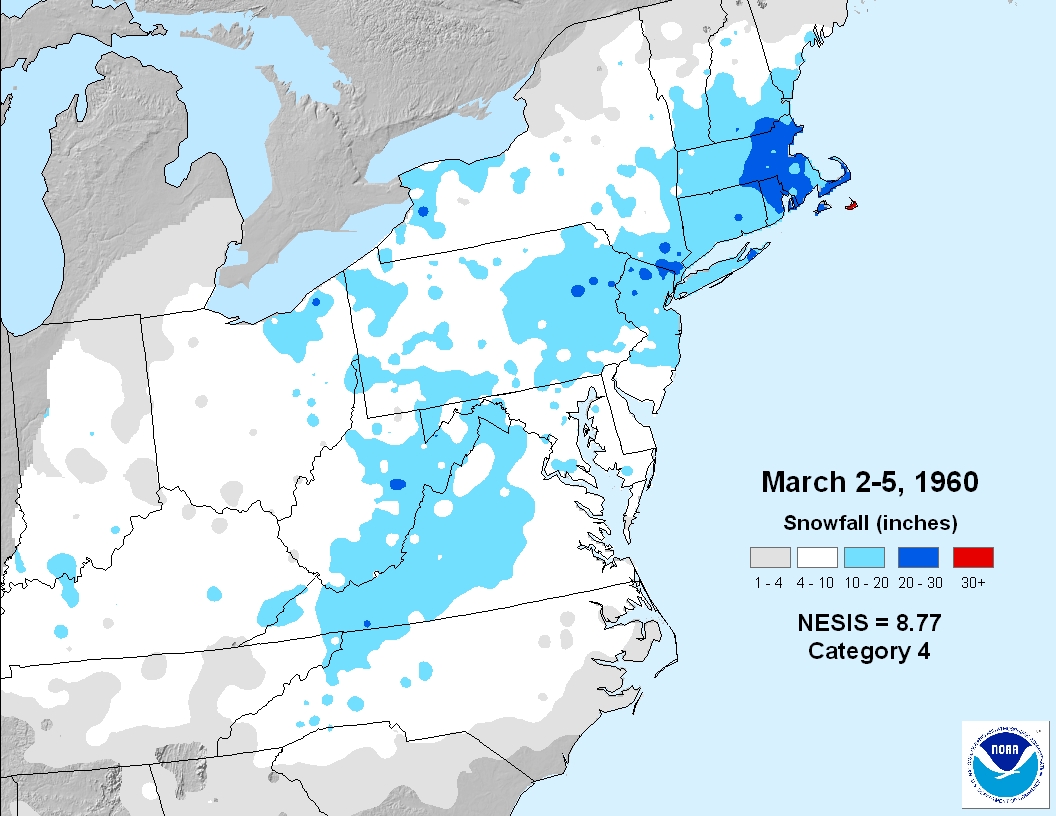
| 3 | 1960-03-02 | 1960-03-05 | 8.77 | 4 | Crippling | view |
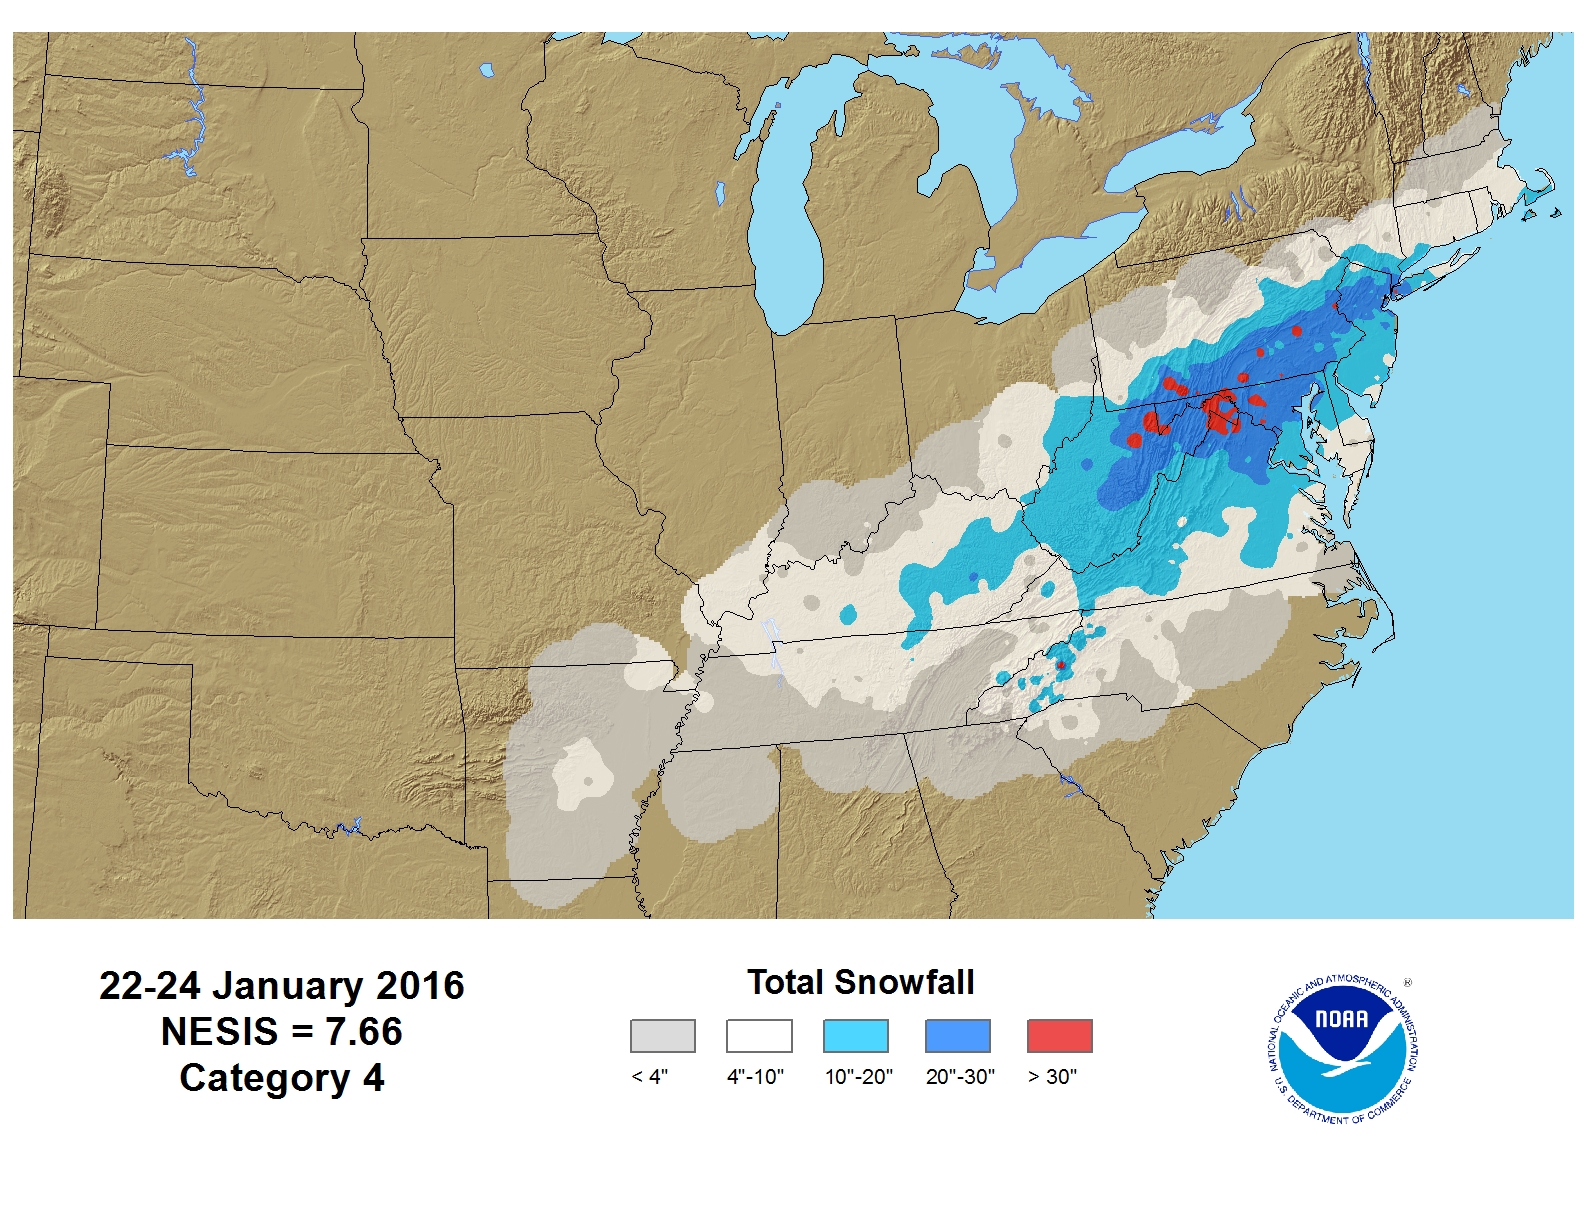
| 4 | 2016-01-22 | 2016-01-24 | 7.66 | 4 | Crippling | view |
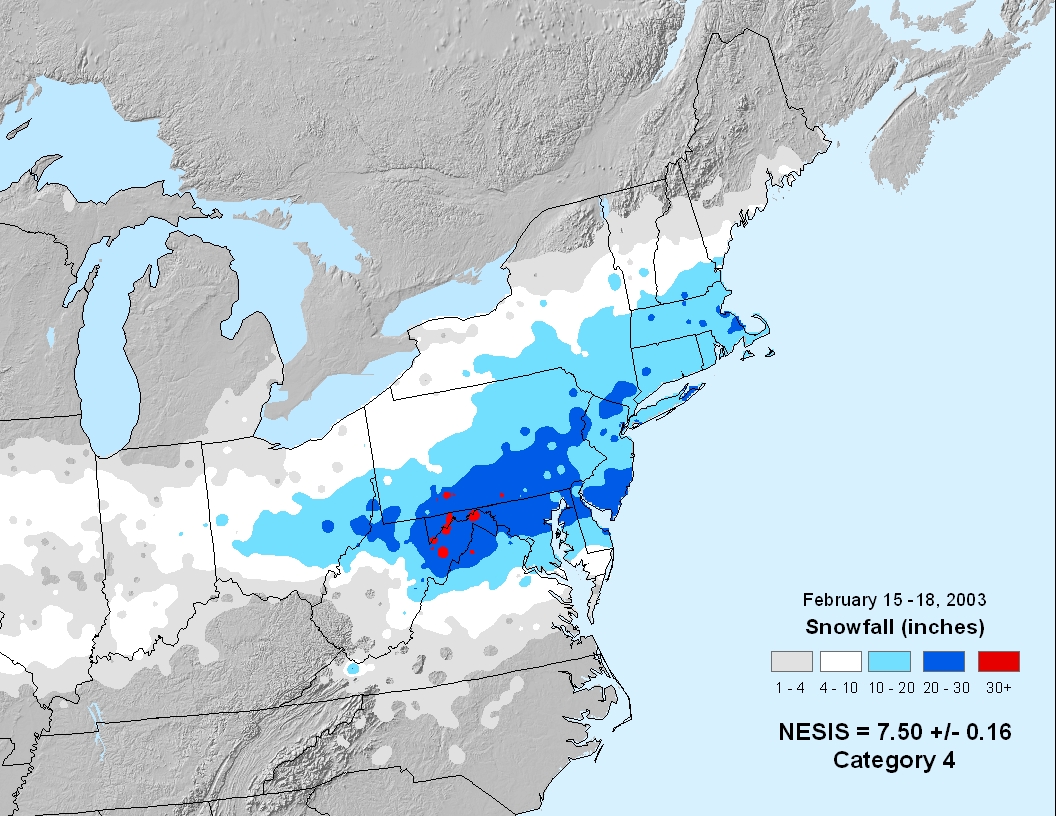
| 5 | 2003-02-15 | 2003-02-18 | 7.50 | 4 | Crippling | view |
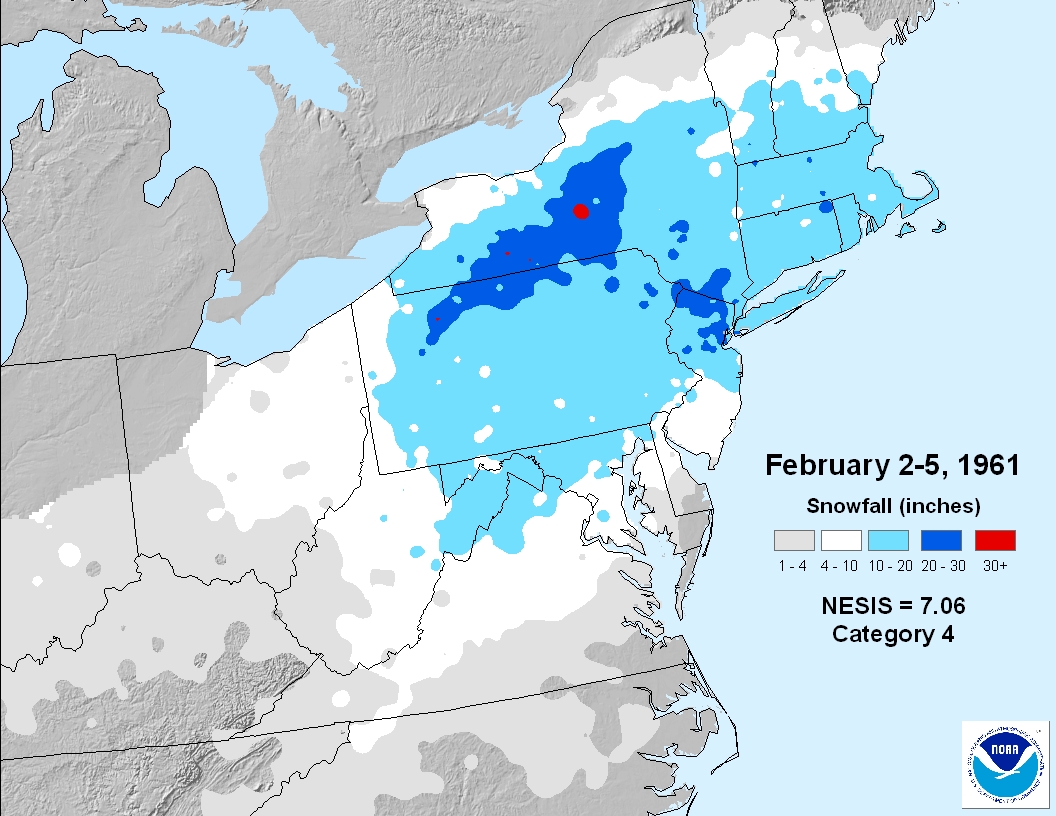
| 6 | 1961-02-02 | 1961-02-05 | 7.06 | 4 | Crippling | view |
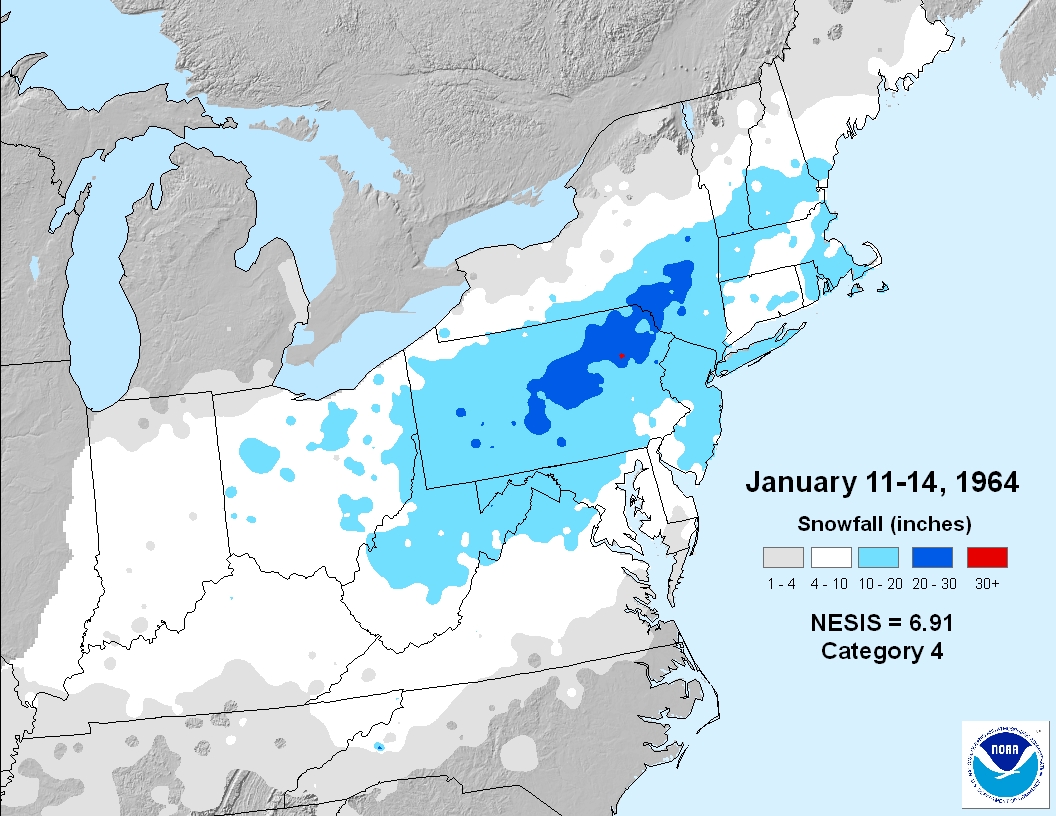
| 7 | 1964-01-11 | 1964-01-14 | 6.91 | 4 | Crippling | view |
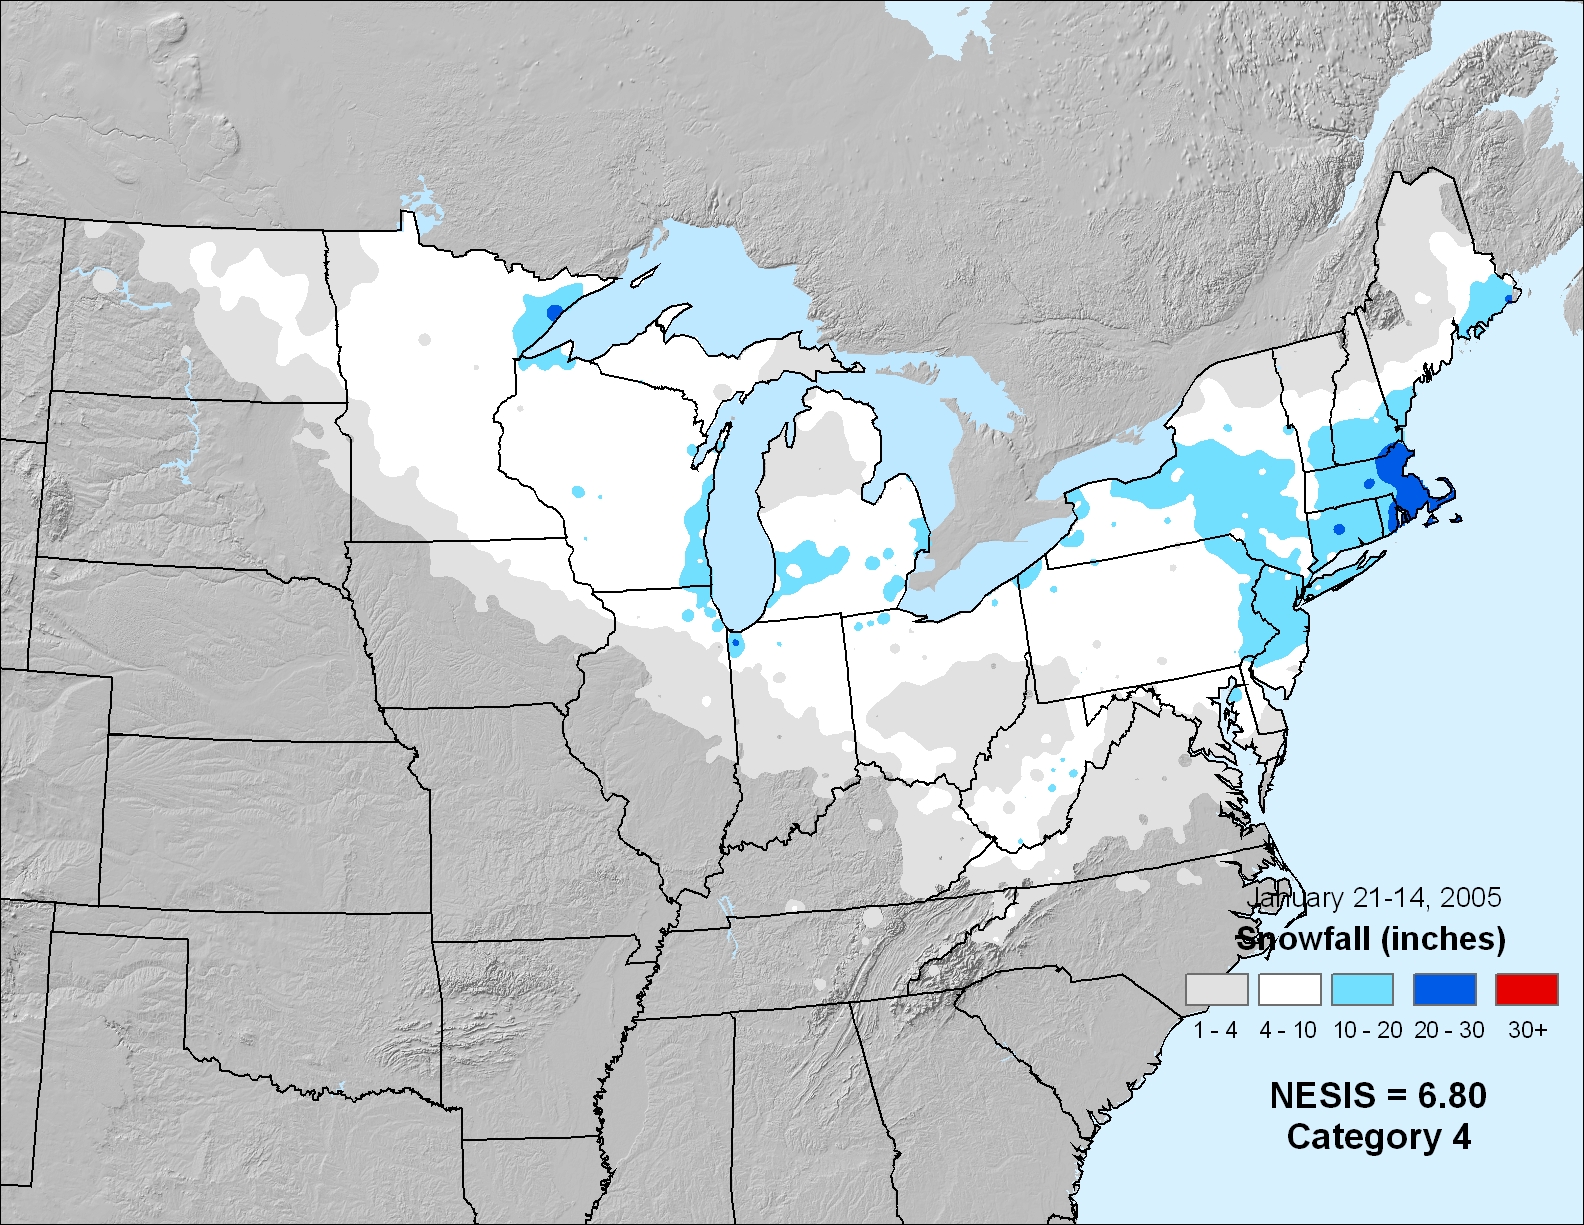
| 8 | 2005-01-21 | 2005-01-24 | 6.80 | 4 | Crippling | view |
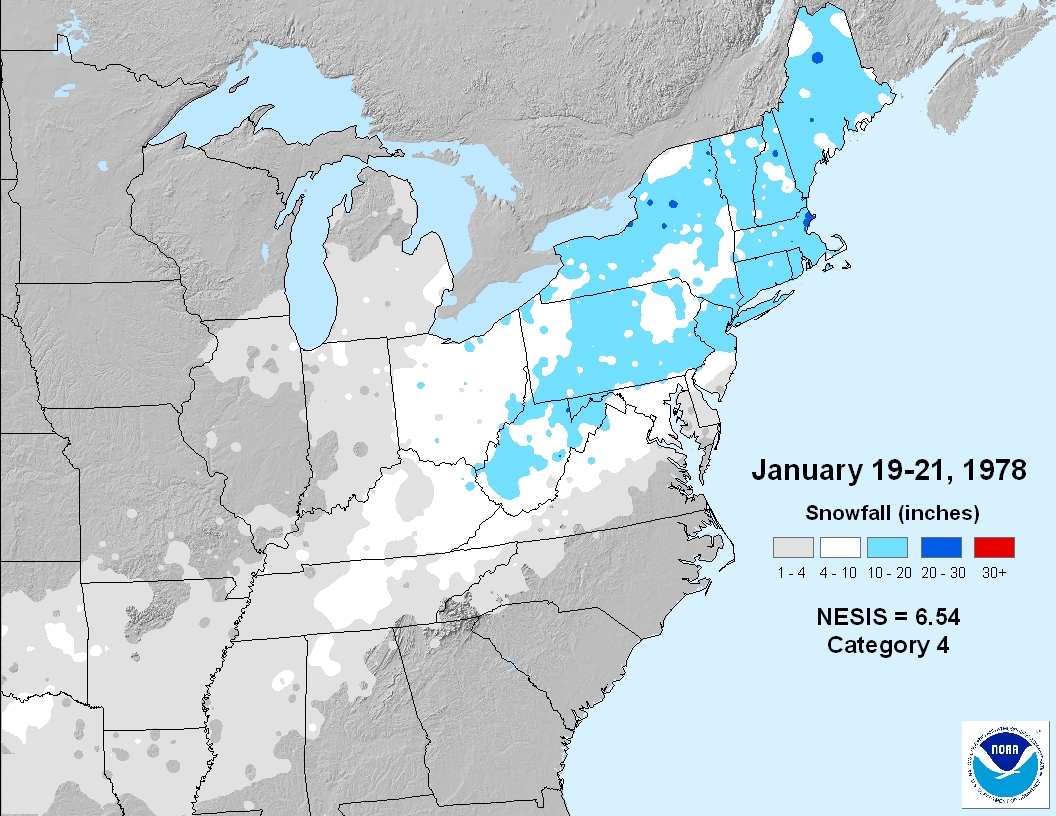
| 9 | 1978-01-19 | 1978-01-21 | 6.53 | 4 | Crippling | view |
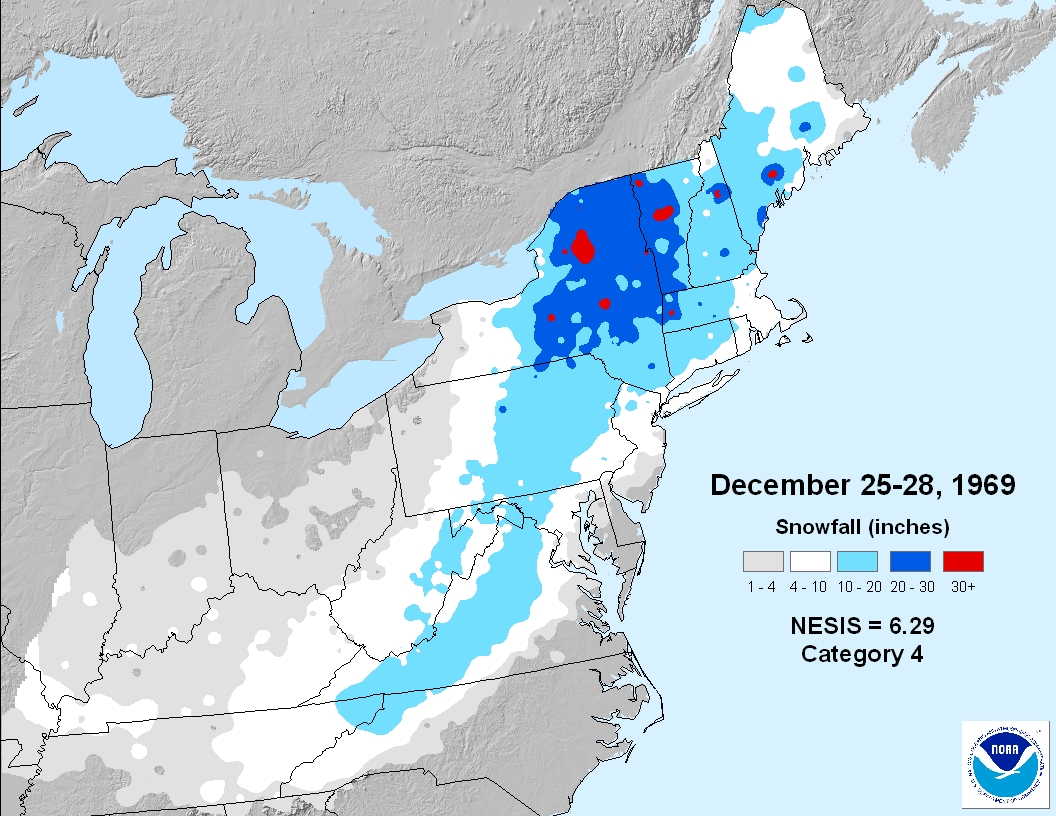
| 10 | 1969-12-25 | 1969-12-28 | 6.29 | 4 | Crippling | view |
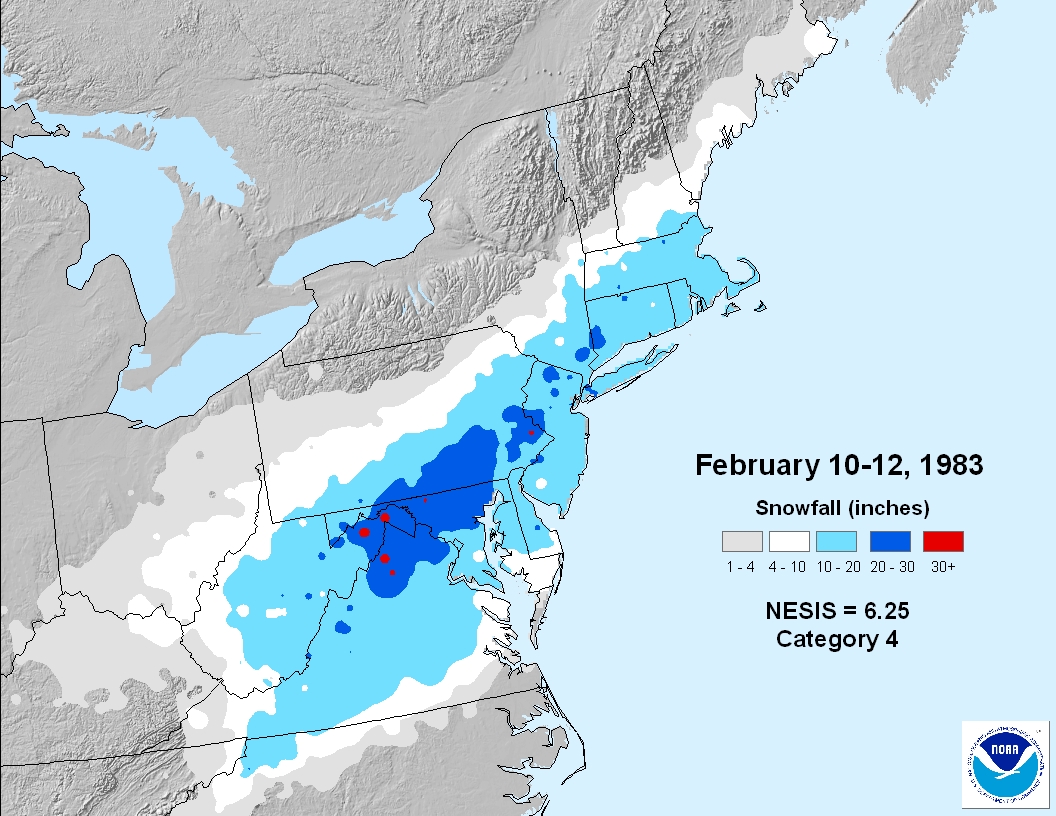
| 11 | 1983-02-10 | 1983-02-12 | 6.25 | 4 | Crippling | view |
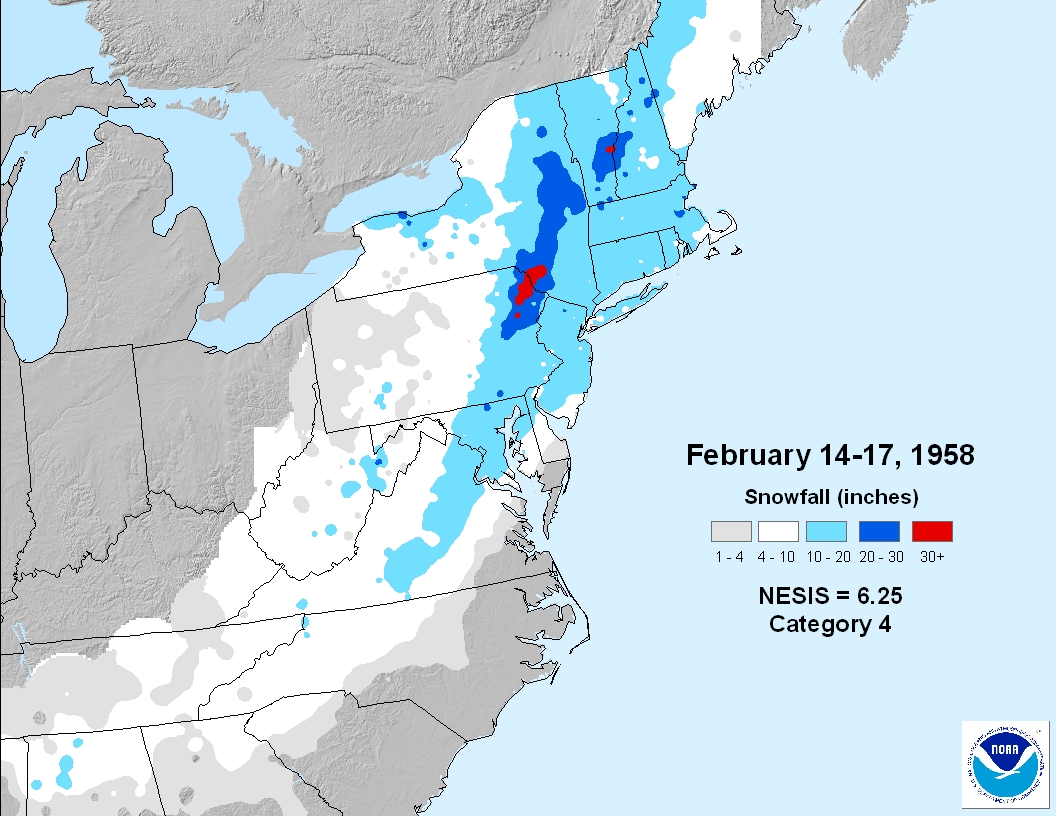
| 12 | 1958-02-14 | 1958-02-17 | 6.25 | 4 | Crippling | view |
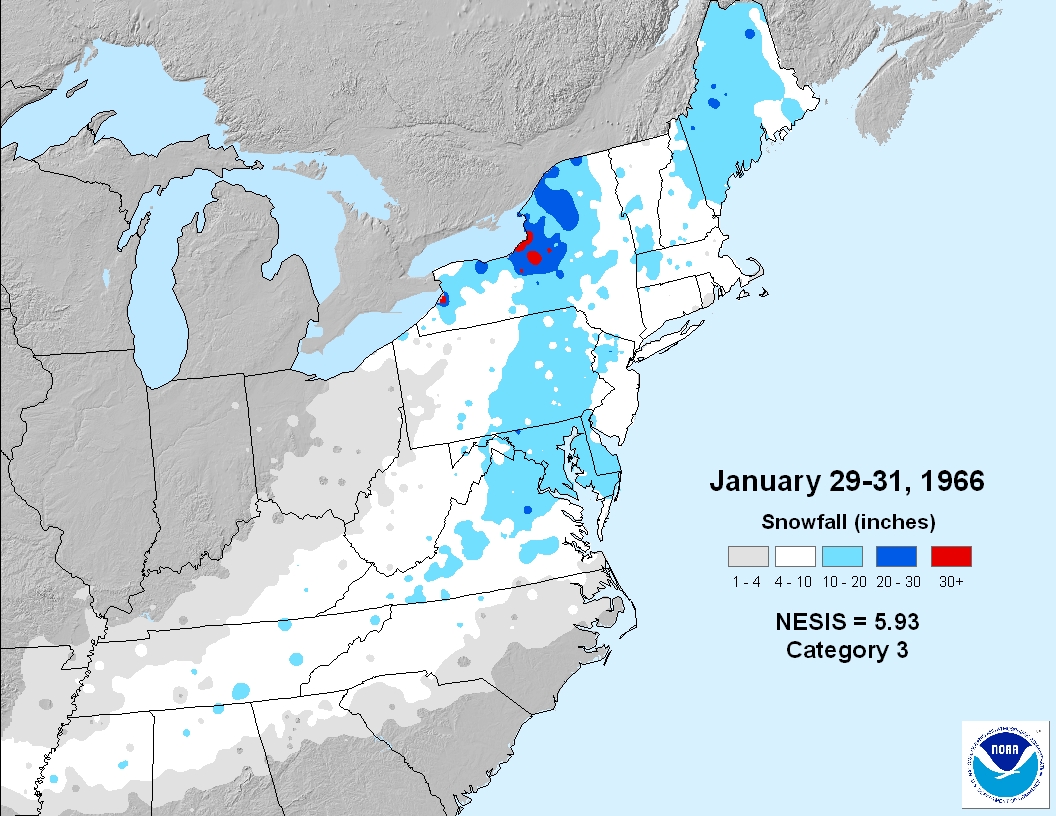
| 13 | 1966-01-29 | 1966-01-31 | 5.93 | 3 | Major | view |
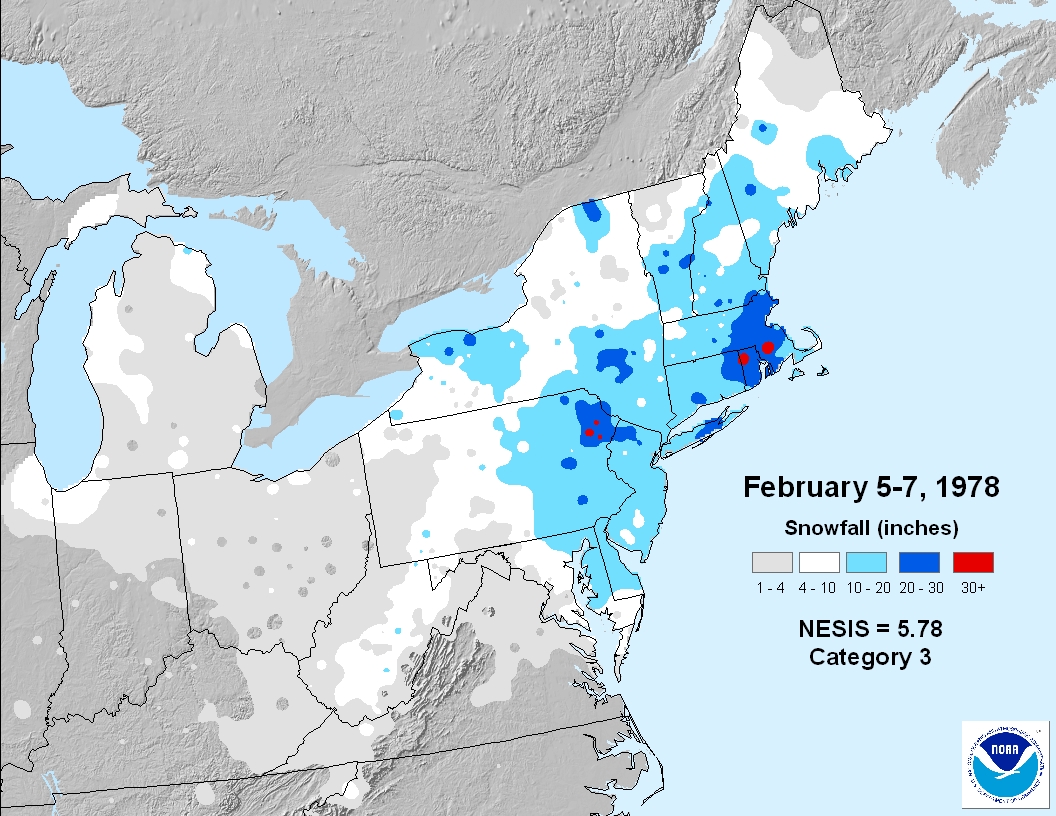
| 14 | 1978-02-05 | 1978-02-07 | 5.78 | 3 | Major | view |
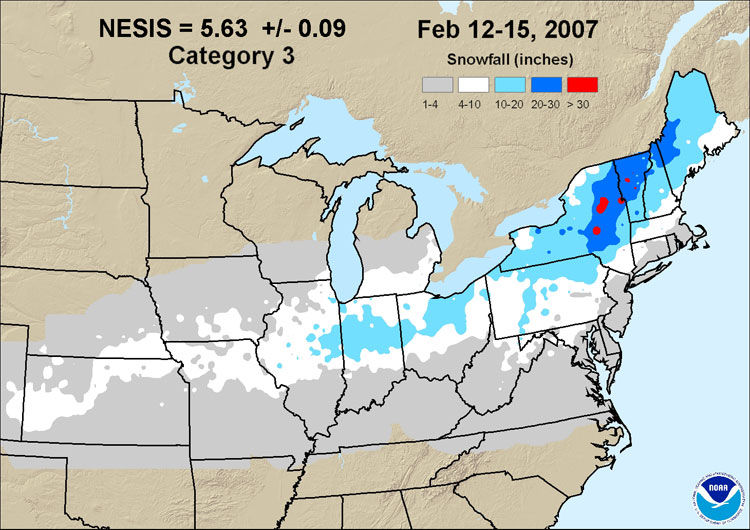
| 15 | 2007-02-12 | 2007-02-15 | 5.63 | 3 | Major | view |
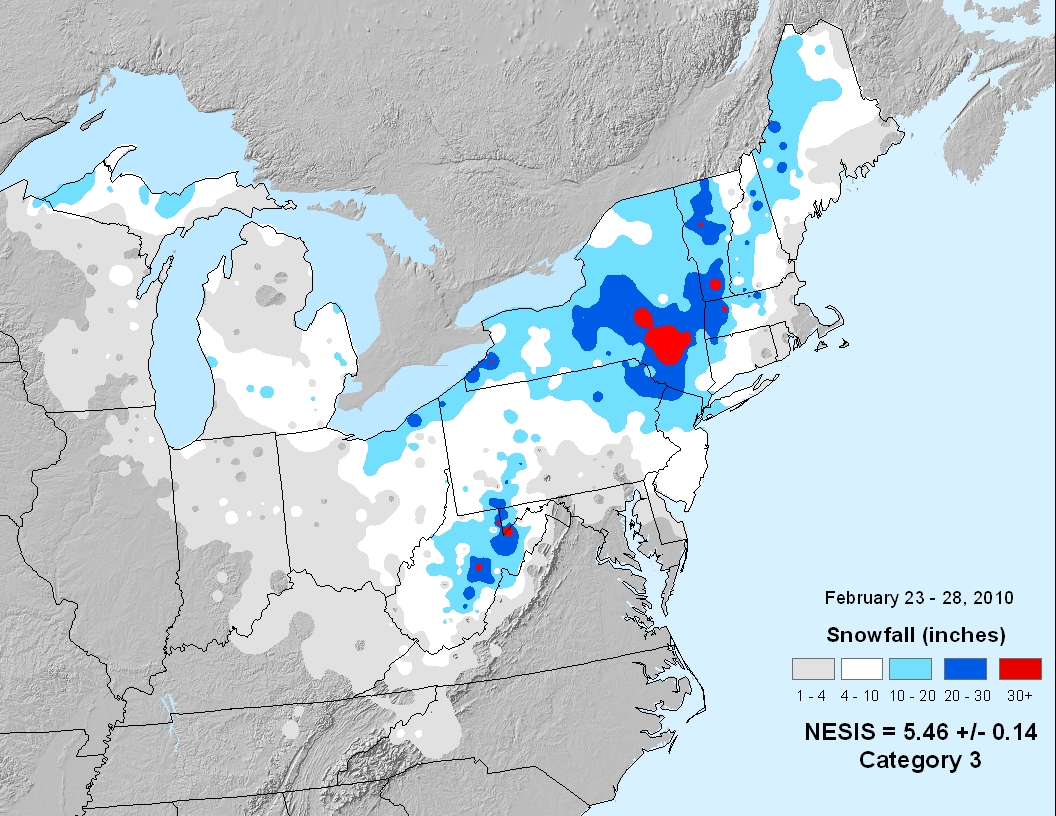
| 16 | 2010-02-23 | 2010-02-28 | 5.46 | 3 | Major | view |
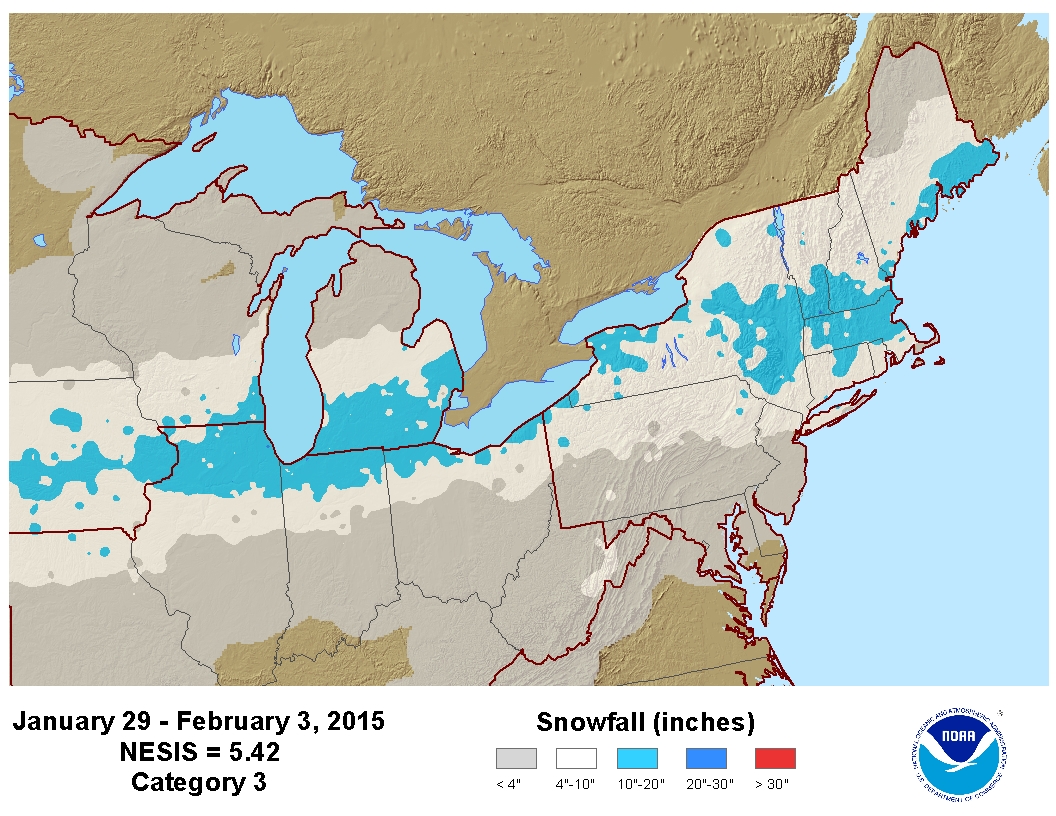
| 17 | 2015-01-29 | 2015-02-03 | 5.42 | 3 | Major | view |
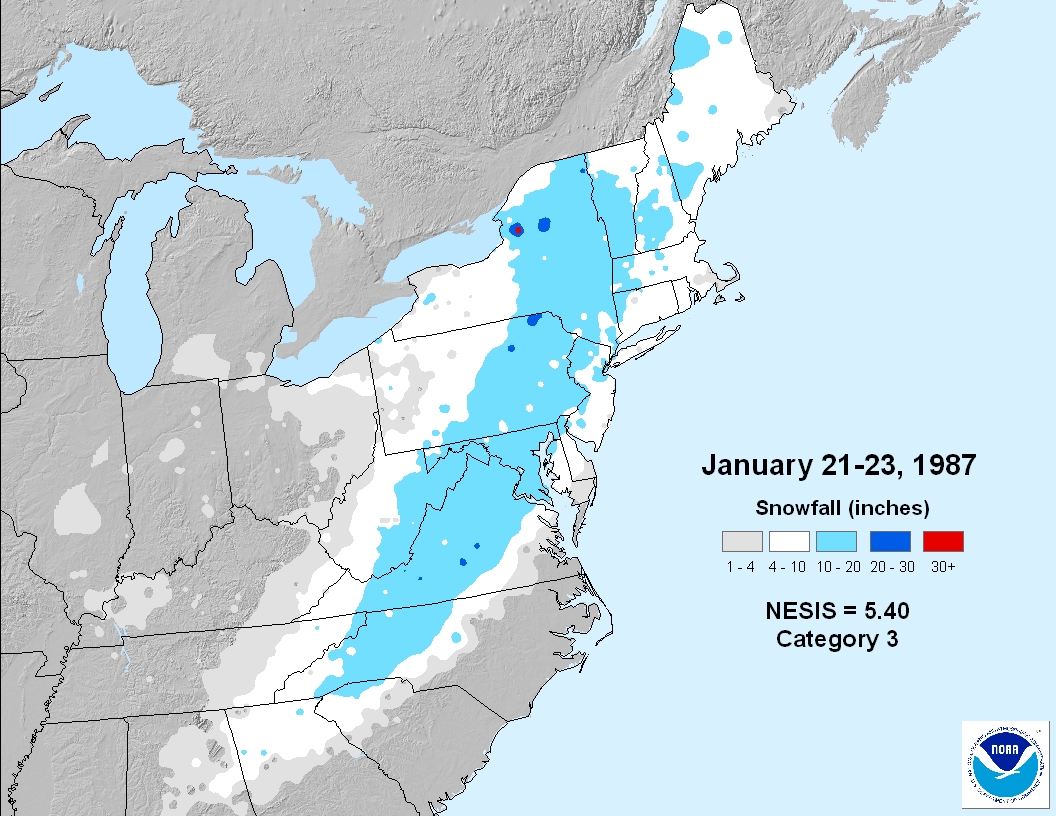
| 18 | 1987-01-21 | 1987-01-23 | 5.40 | 3 | Major | view |
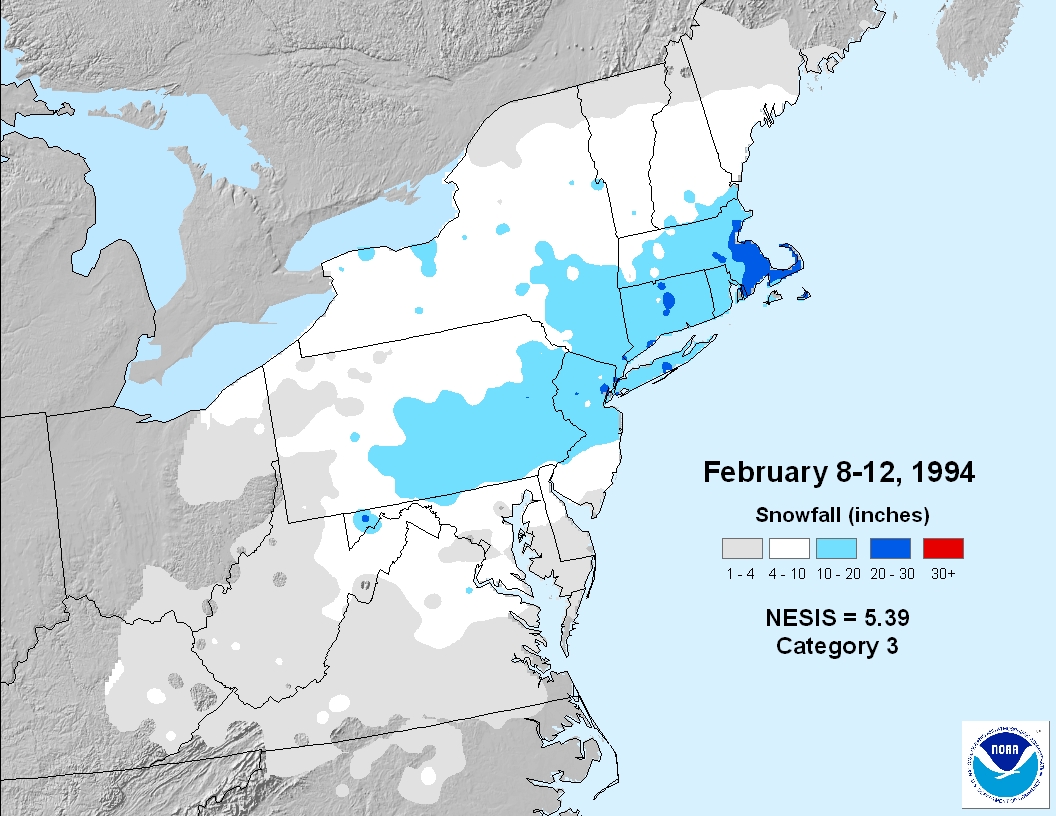
| 19 | 1994-02-08 | 1994-02-12 | 5.39 | 3 | Major | view |
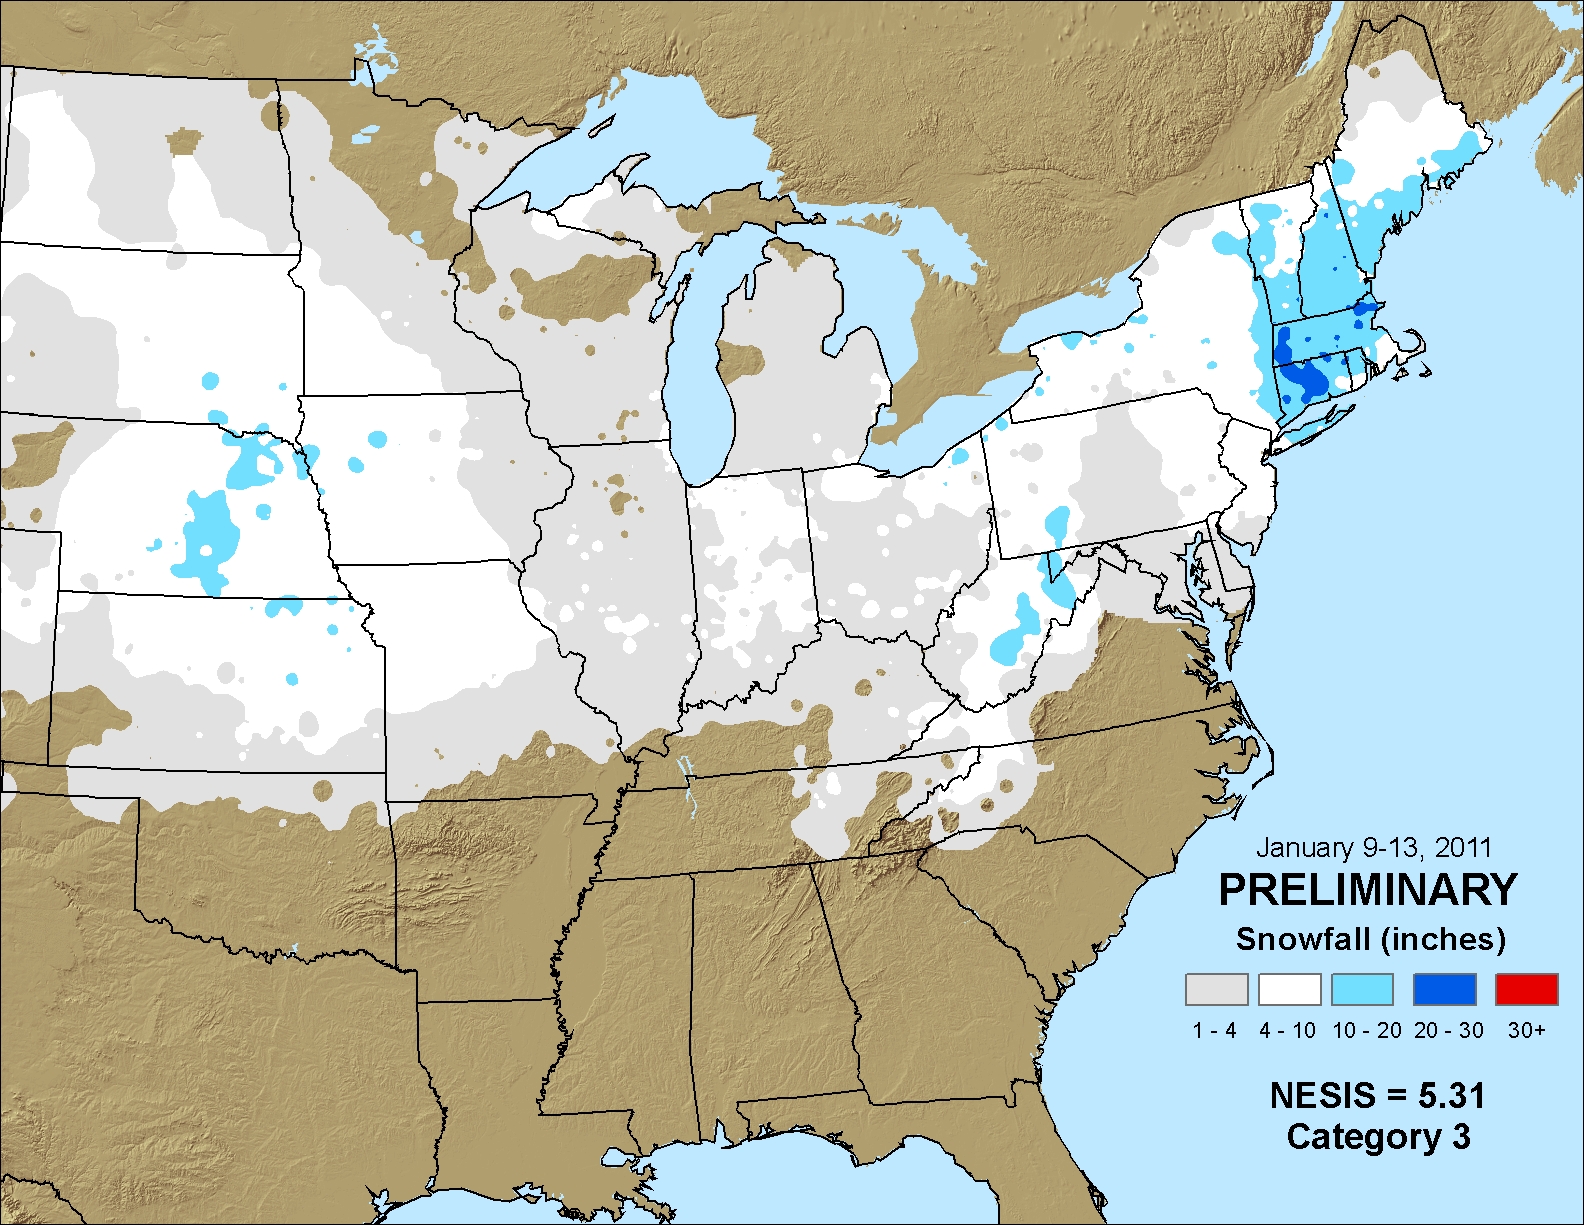
| 20 | 2011-01-09 | 2011-01-13 | 5.31 | 3 | Major | view |
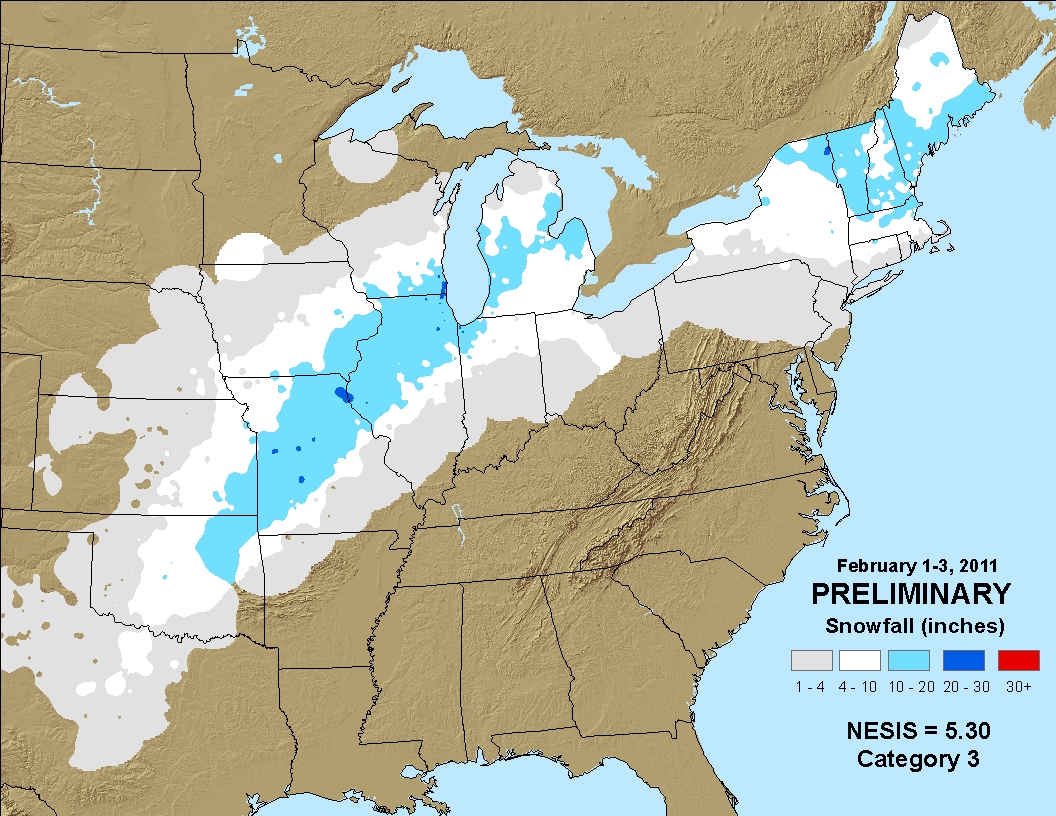
| 21 | 2011-02-01 | 2011-02-03 | 5.30 | 3 | Major | view |
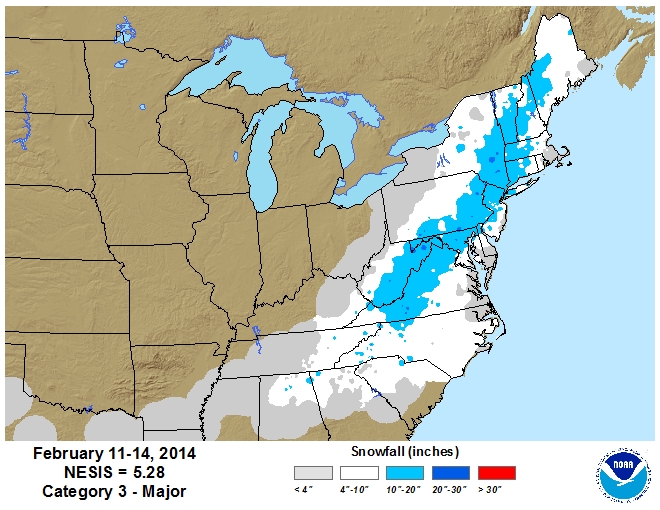
| 22 | 2014-02-11 | 2014-02-14 | 5.28 | 3 | Major | view |
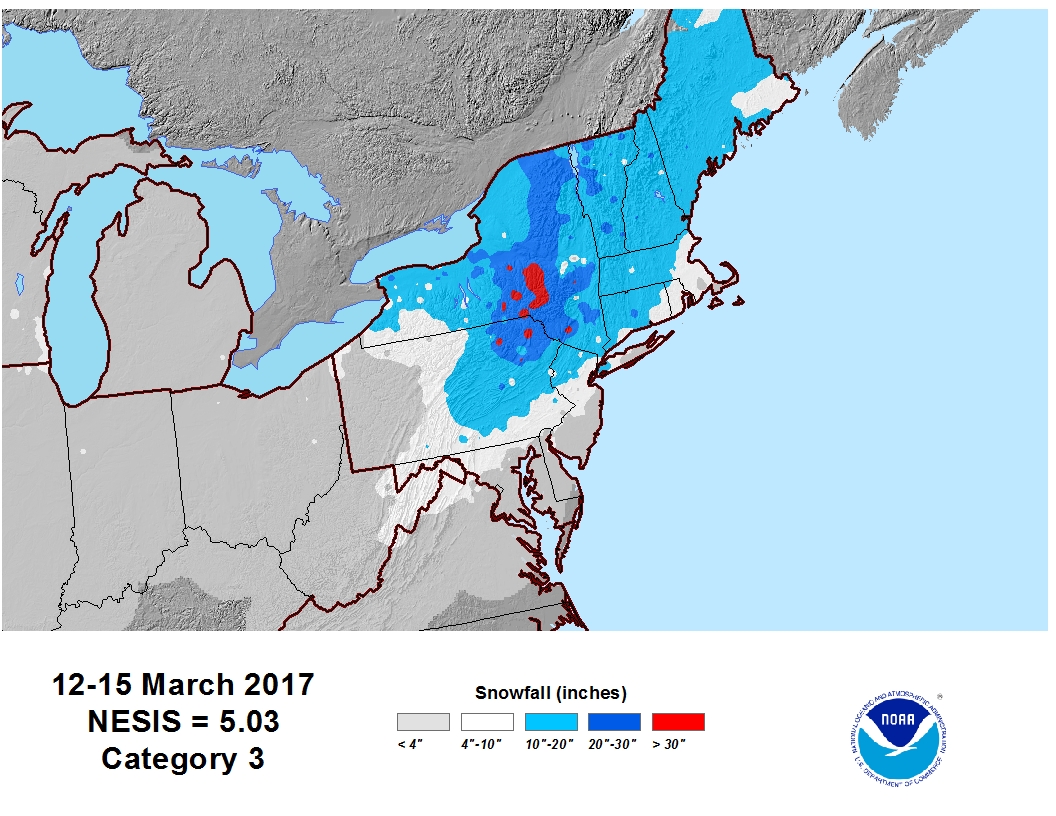
| 23 | 2017-03-12 | 2017-03-15 | 5.03 | 3 | Major | view |
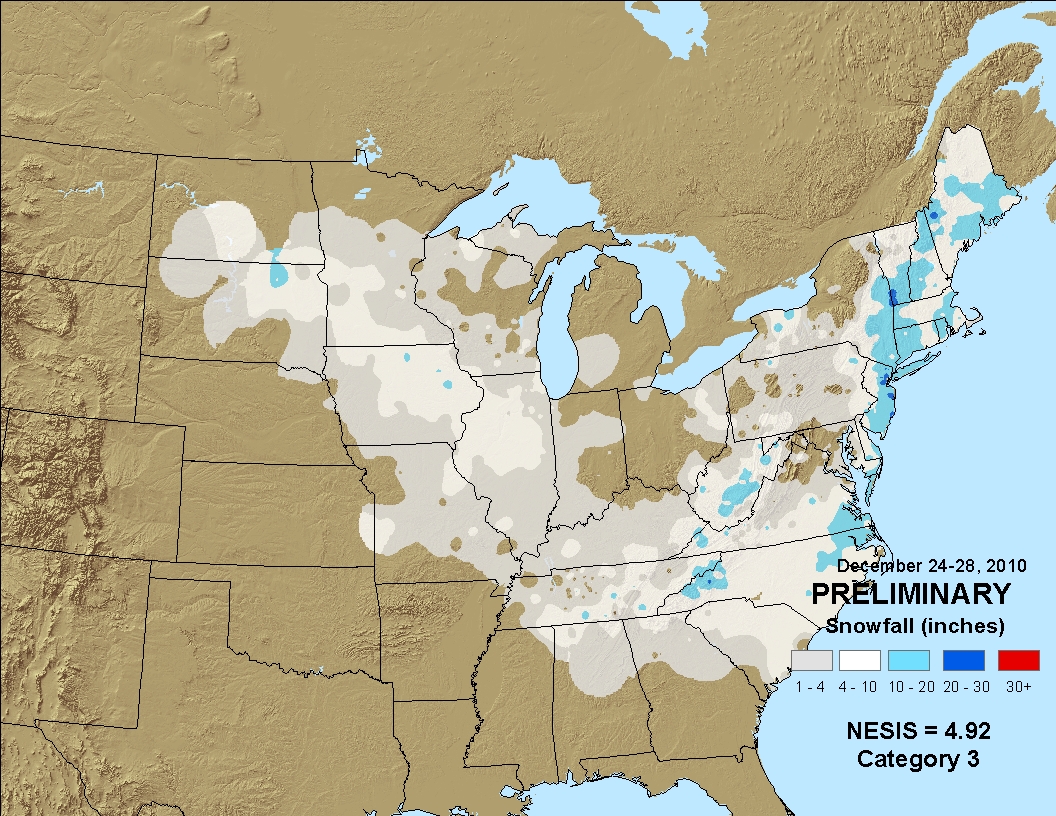
| 24 | 2010-12-24 | 2010-12-28 | 4.92 | 3 | Major | view |
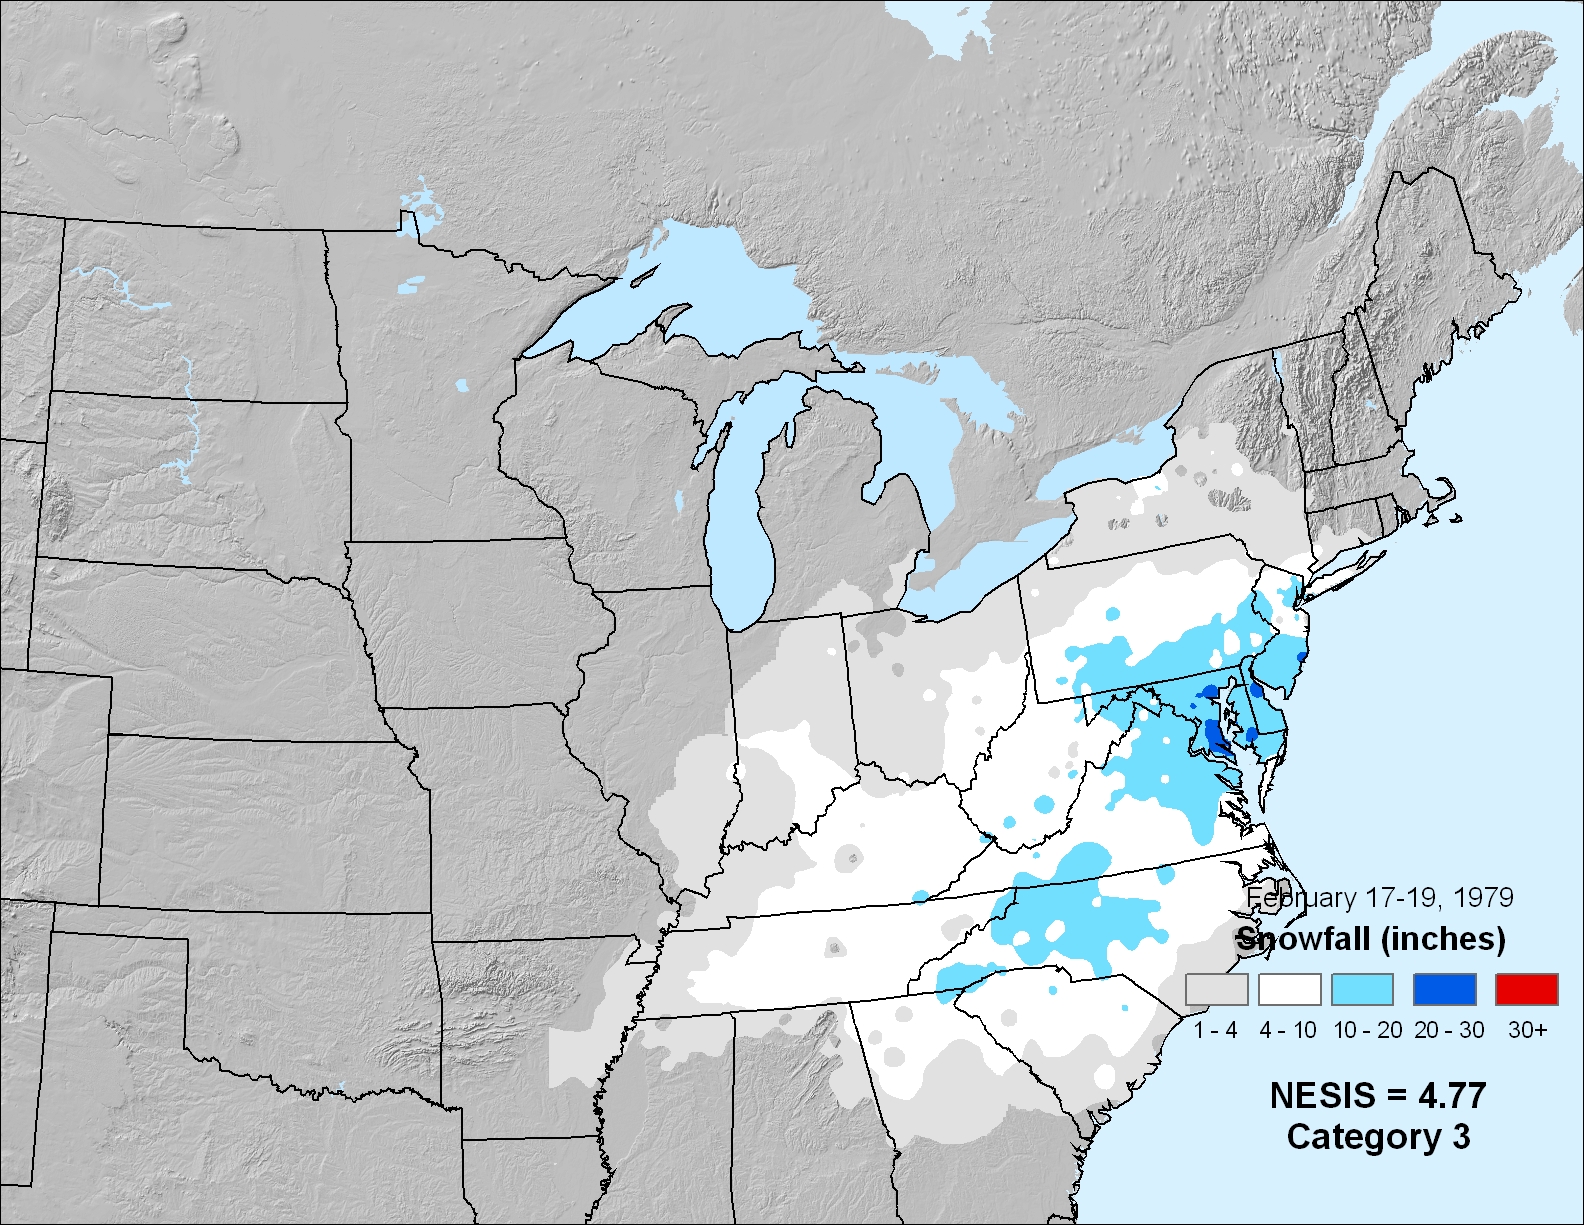
| 25 | 1979-02-17 | 1979-02-19 | 4.77 | 3 | Major | view |
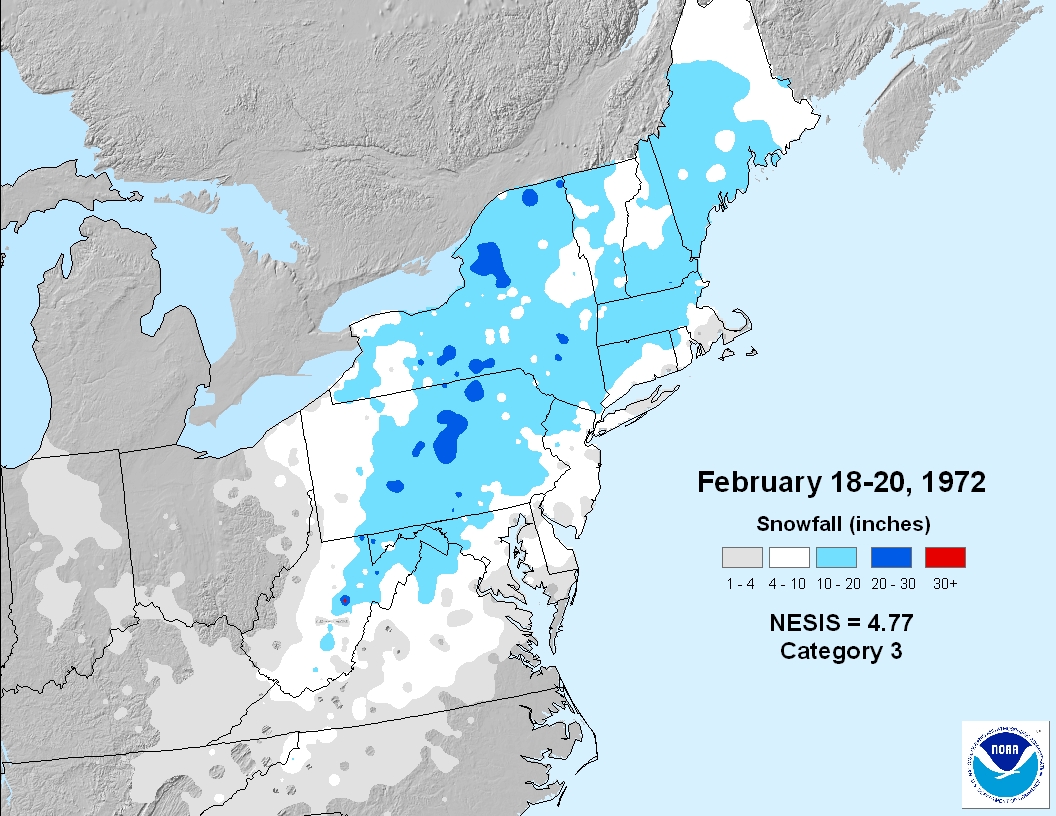
| 26 | 1972-02-18 | 1972-02-20 | 4.77 | 3 | Major | view |
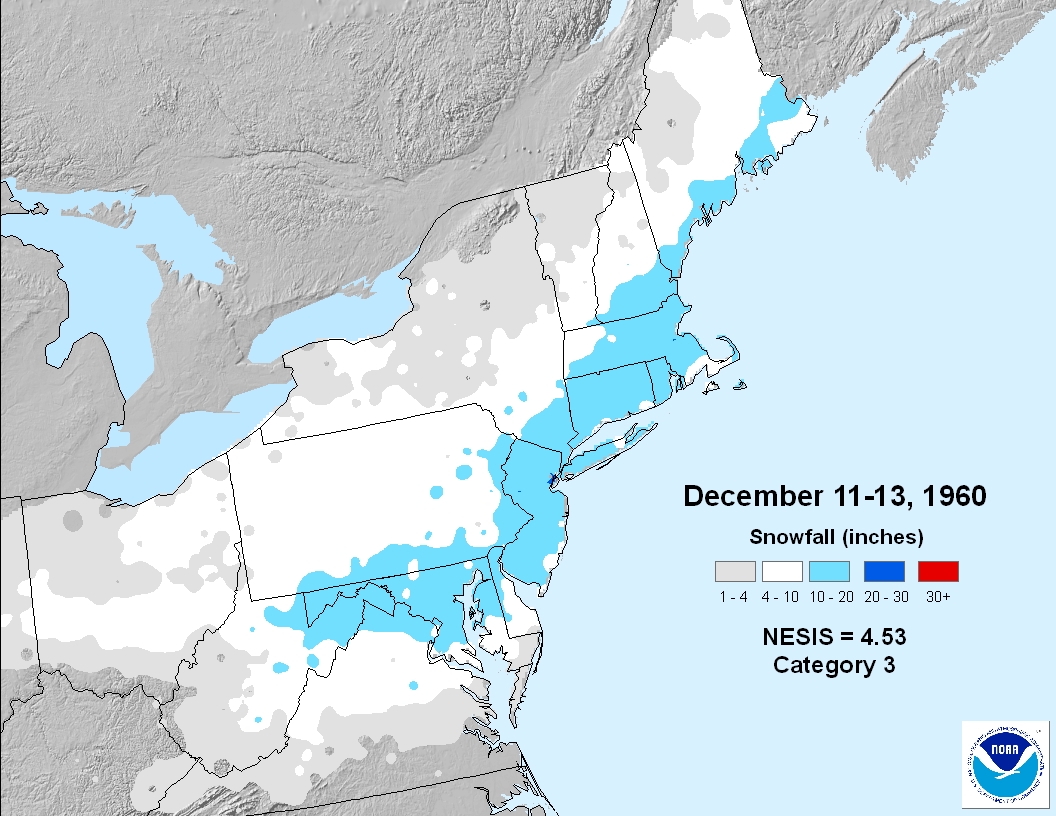
| 27 | 1960-12-11 | 1960-12-13 | 4.53 | 3 | Major | view |
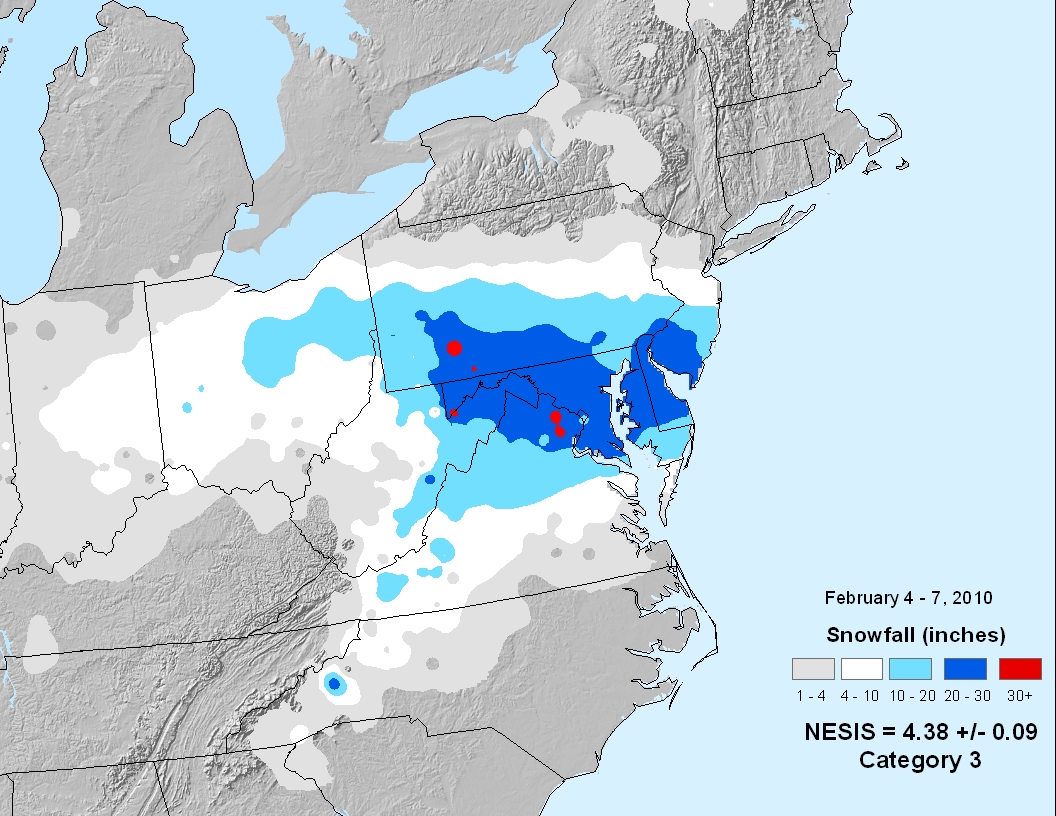
| 28 | 2010-02-04 | 2010-02-07 | 4.38 | 3 | Major | view |
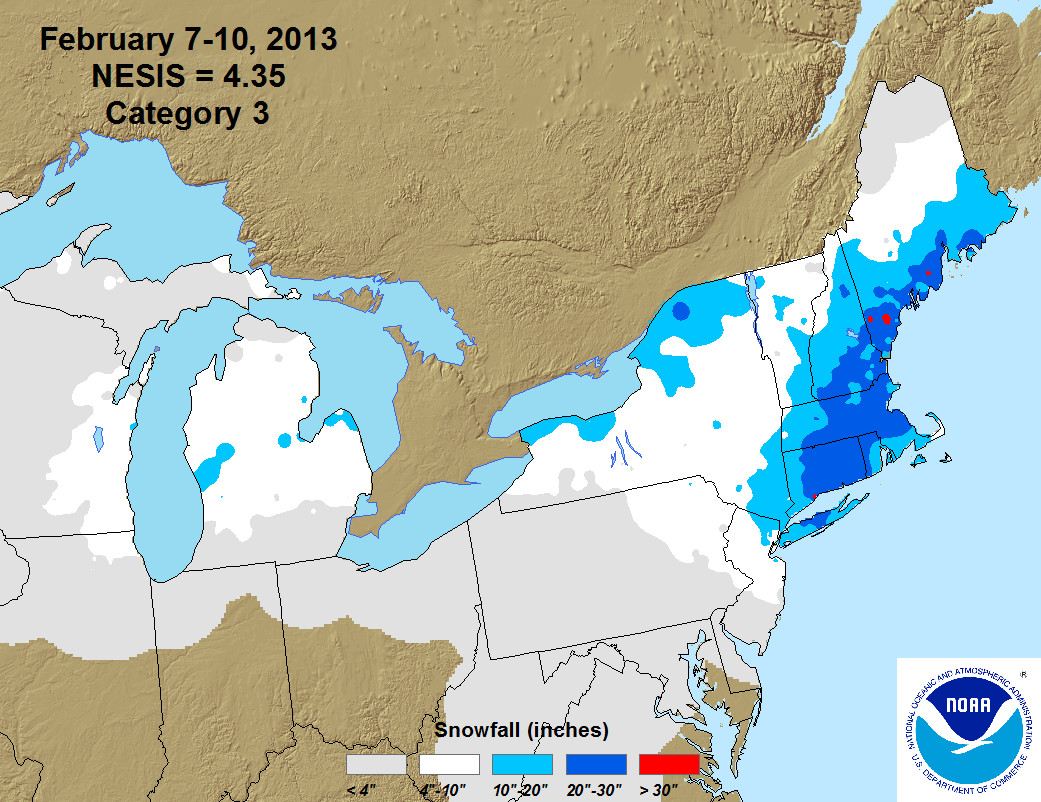
| 29 | 2013-02-07 | 2013-02-10 | 4.35 | 3 | Major | view |
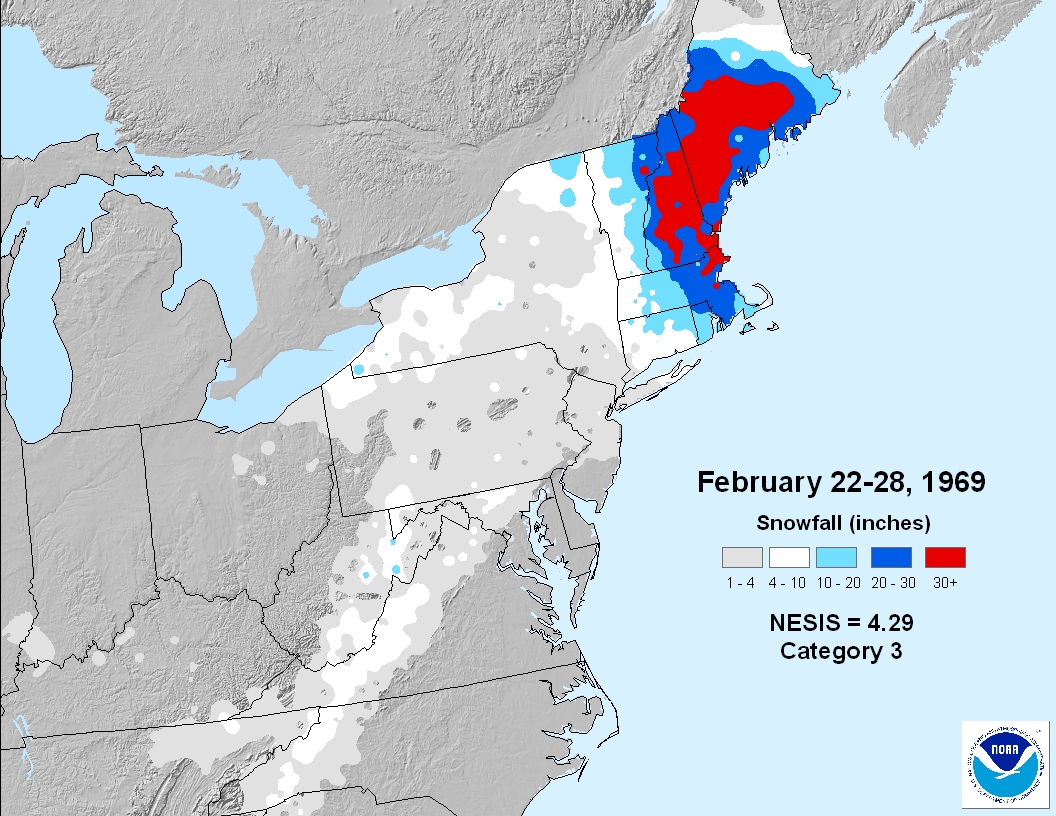
| 30 | 1969-02-22 | 1969-02-28 | 4.29 | 3 | Major | view |
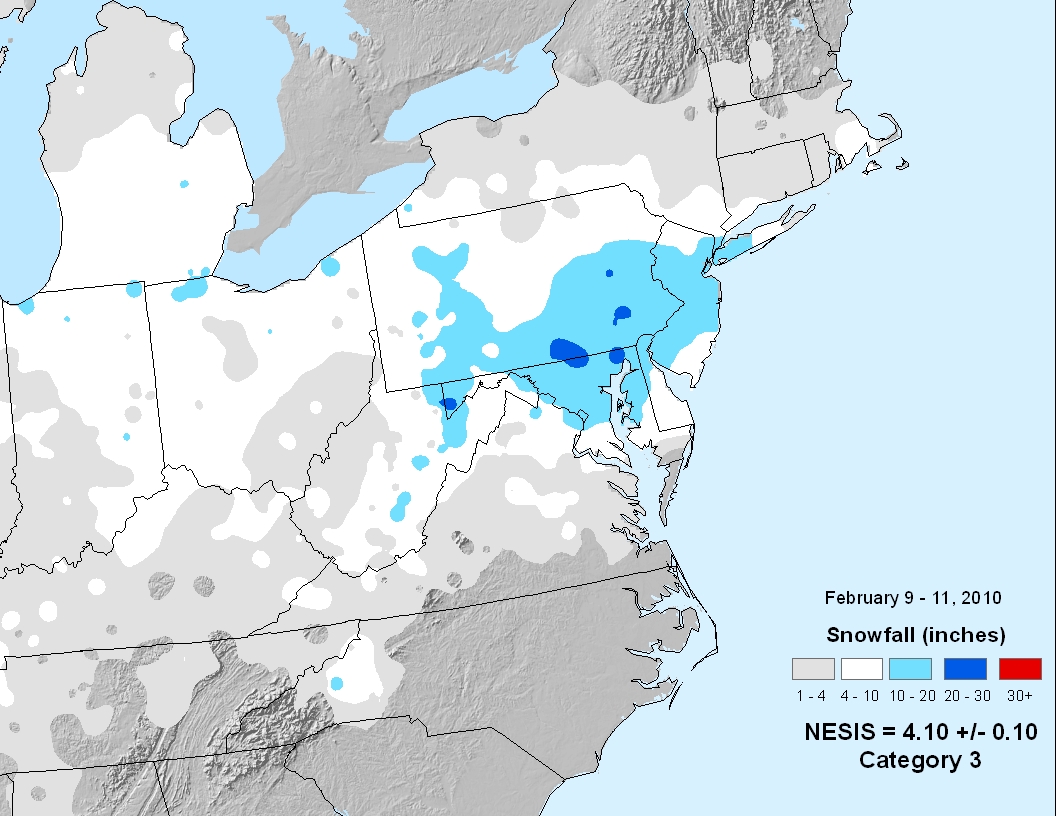
| 31 | 2010-02-09 | 2010-02-11 | 4.10 | 3 | Major | view |
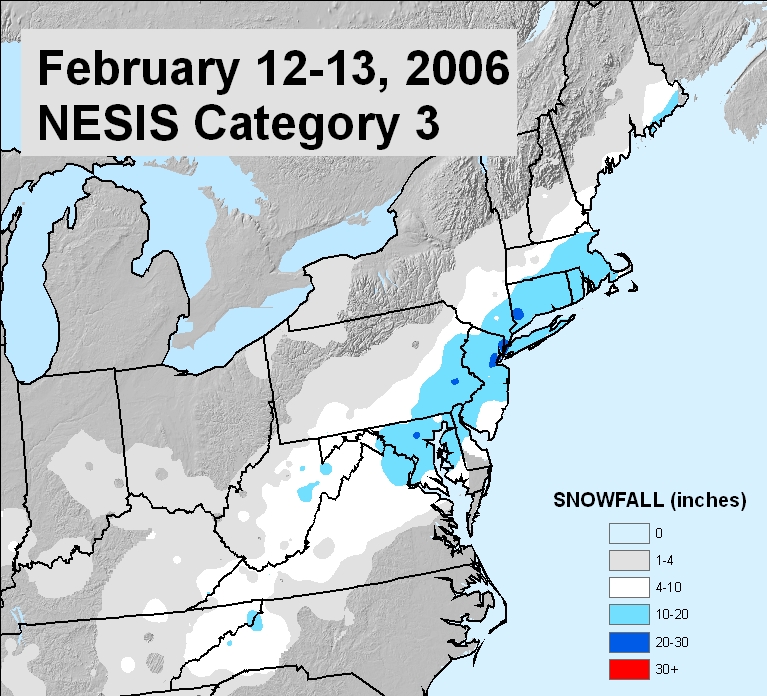
| 32 | 2006-02-12 | 2006-02-13 | 4.10 | 3 | Major | view |
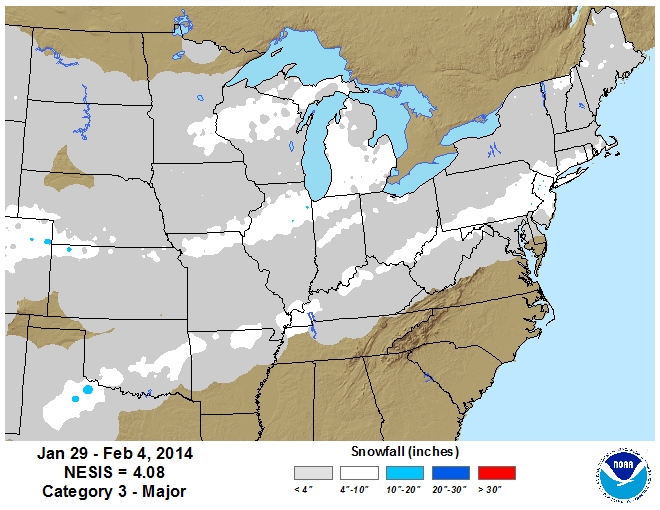
| 33 | 2014-01-29 | 2014-02-04 | 4.08 | 3 | Major | view |
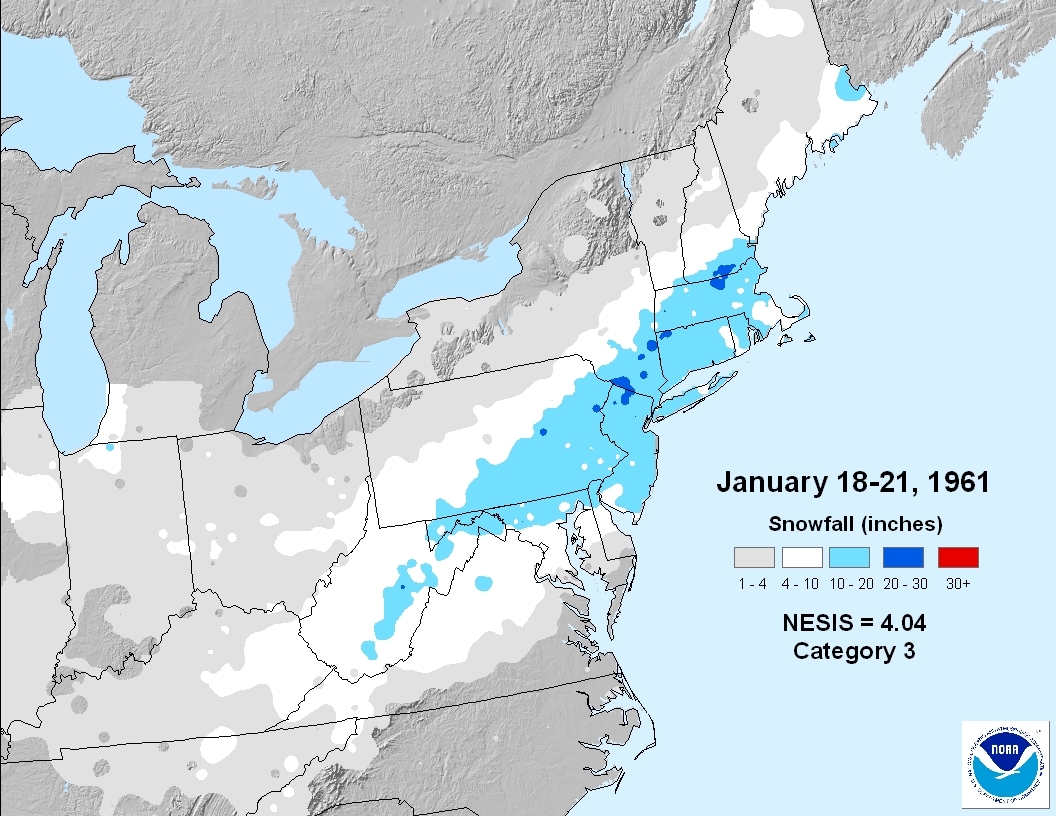
| 34 | 1961-01-18 | 1961-01-21 | 4.04 | 3 | Major | view |
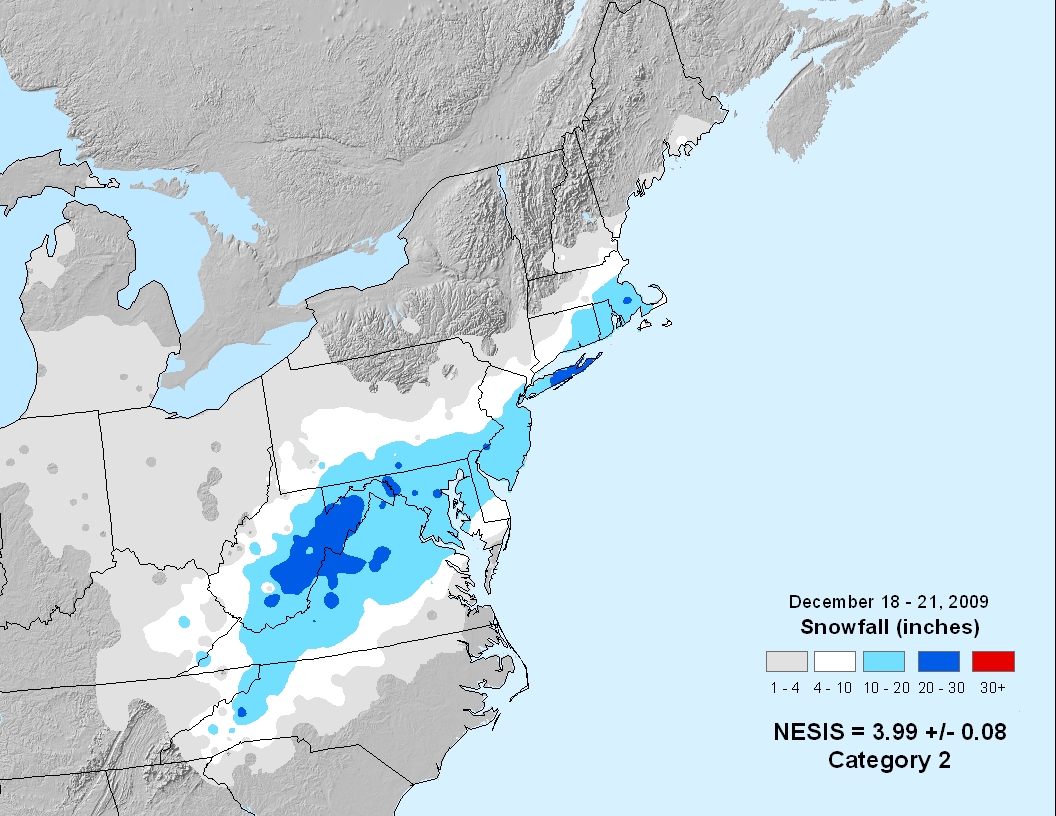
| 35 | 2009-12-18 | 2009-12-21 | 3.99 | 2 | Significant | view |
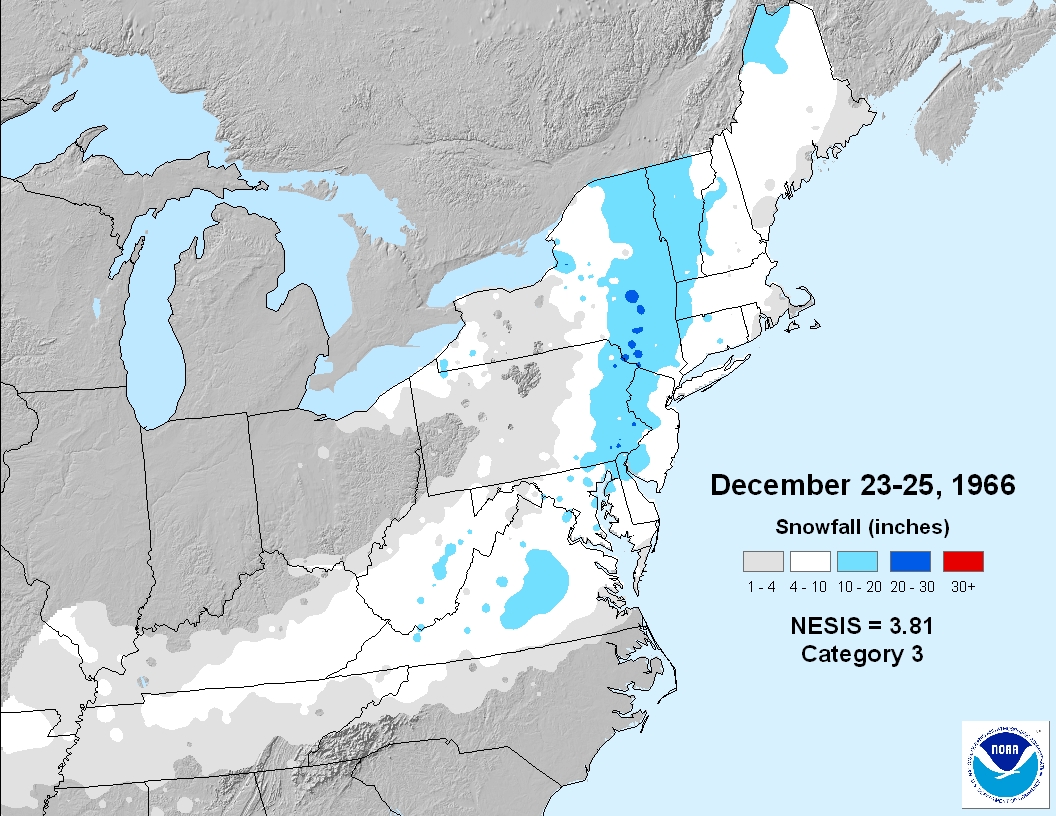
| 36 | 1966-12-23 | 1966-12-25 | 3.81 | 2 | Significant | view |
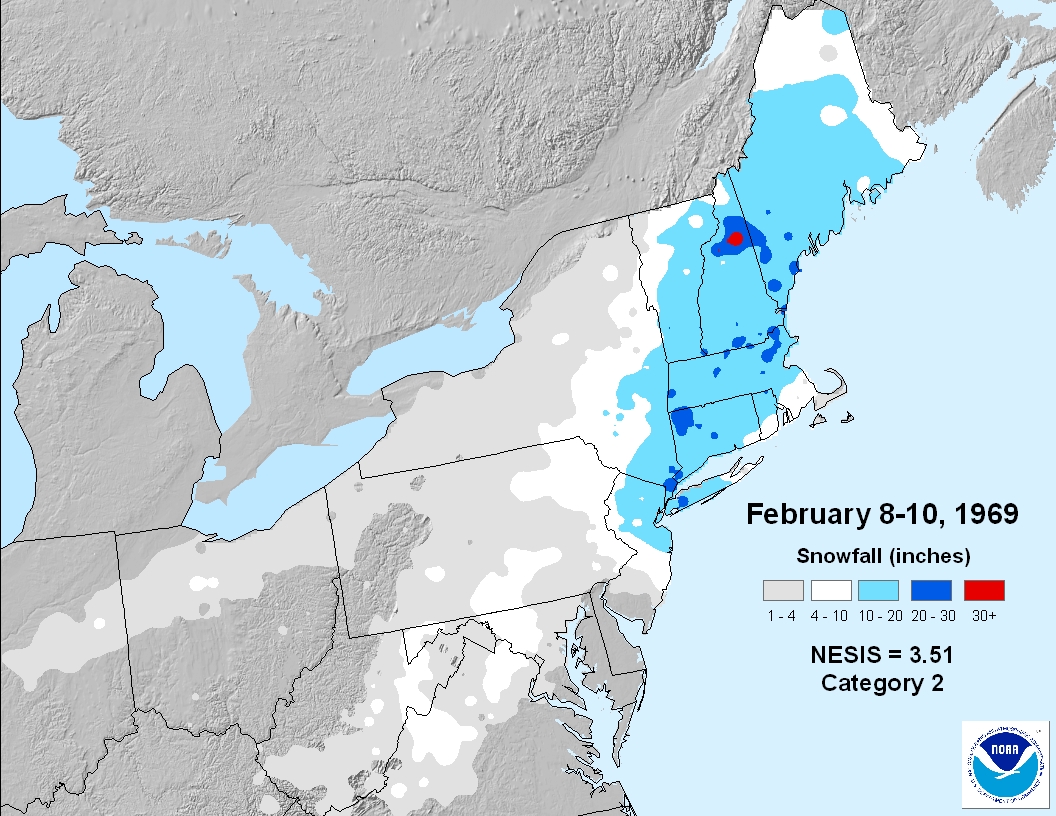
| 37 | 1969-02-08 | 1969-02-10 | 3.51 | 2 | Significant | view |
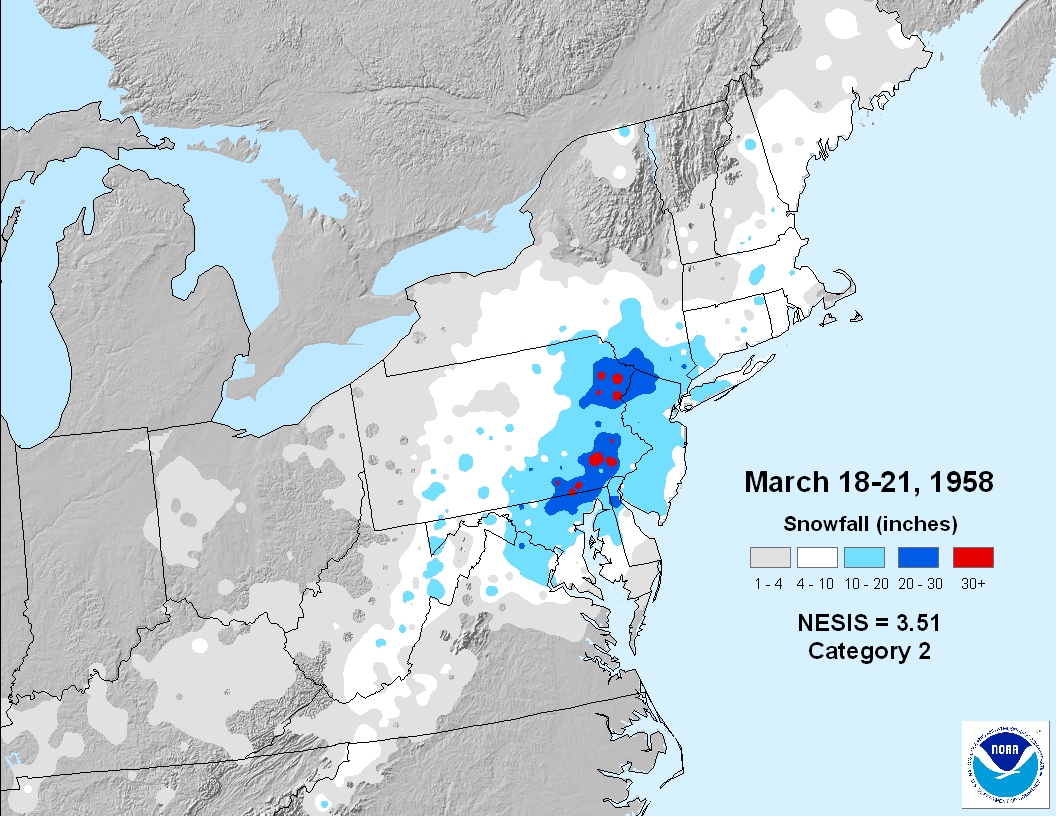
| 38 | 1958-03-18 | 1958-03-21 | 3.51 | 2 | Significant | view |
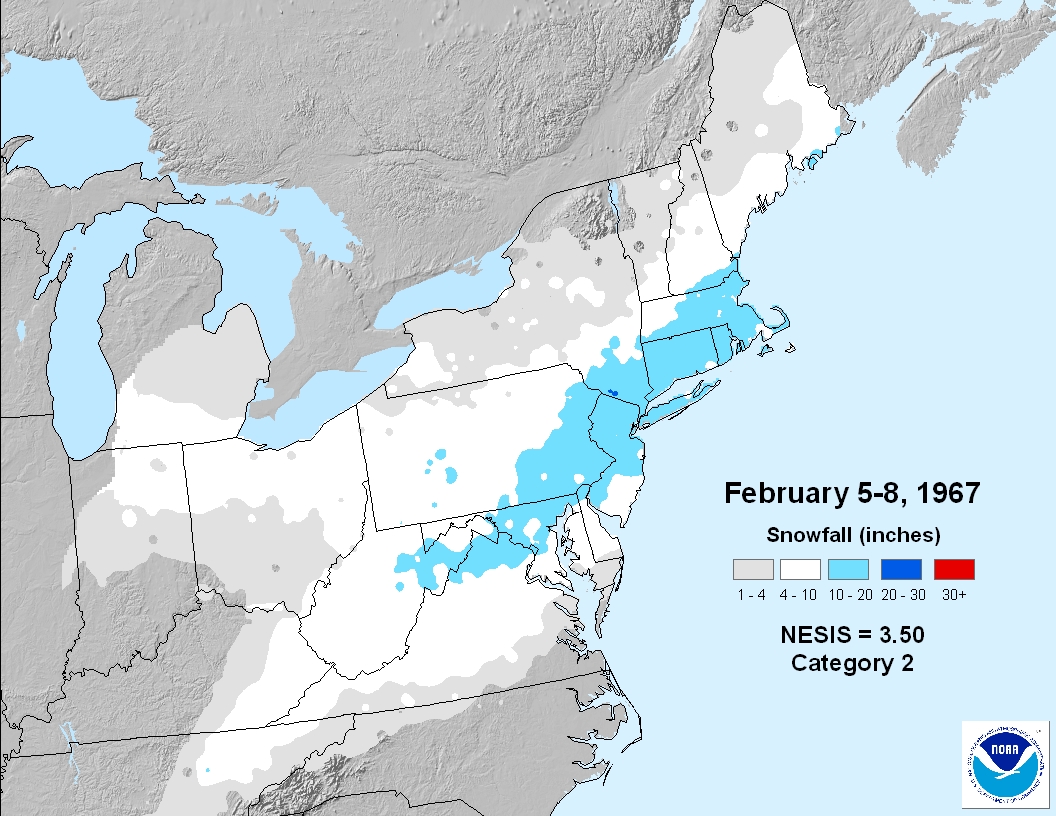
| 39 | 1967-02-05 | 1967-02-08 | 3.50 | 2 | Significant | view |
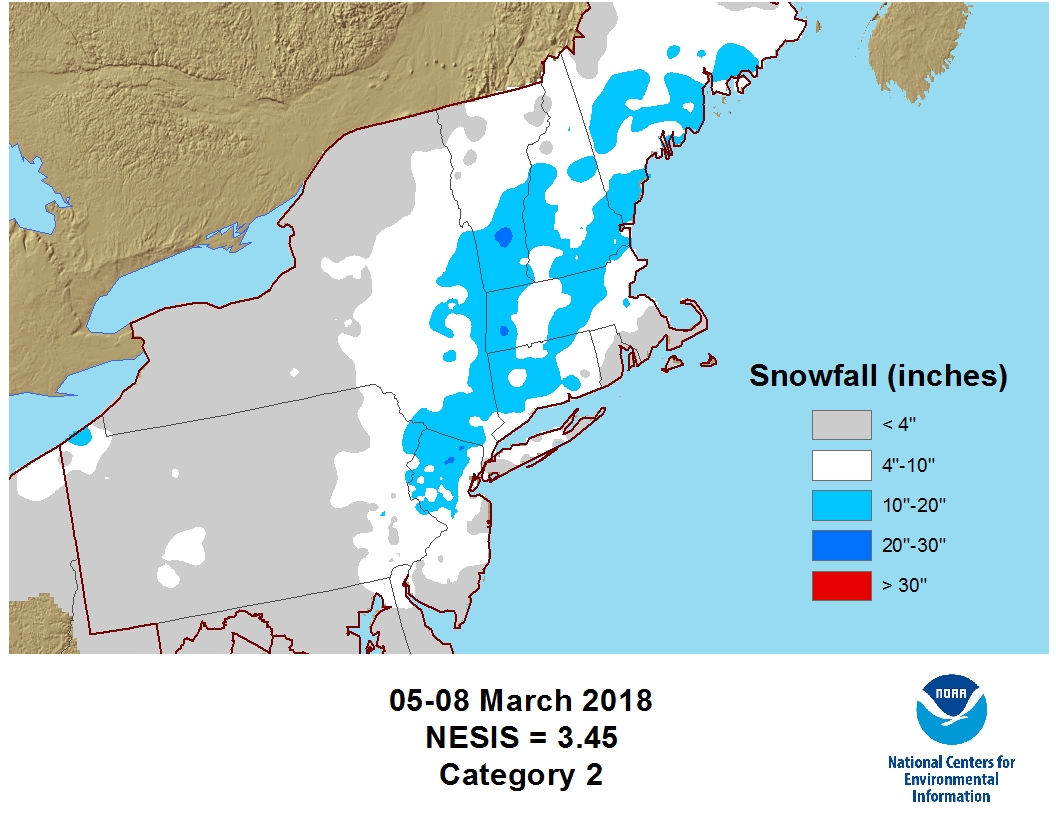
| 40 | 2018-03-05 | 2018-03-08 | 3.45 | 2 | Significant | view |
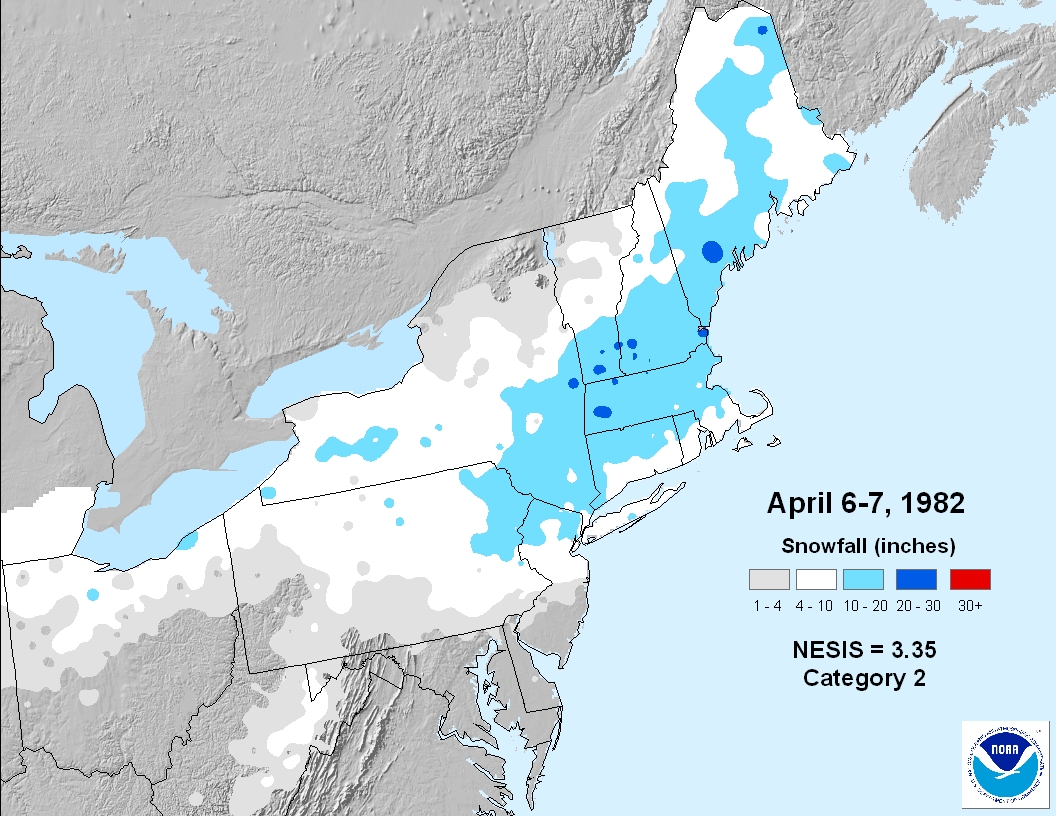
| 41 | 1982-04-06 | 1982-04-07 | 3.35 | 2 | Significant | view |
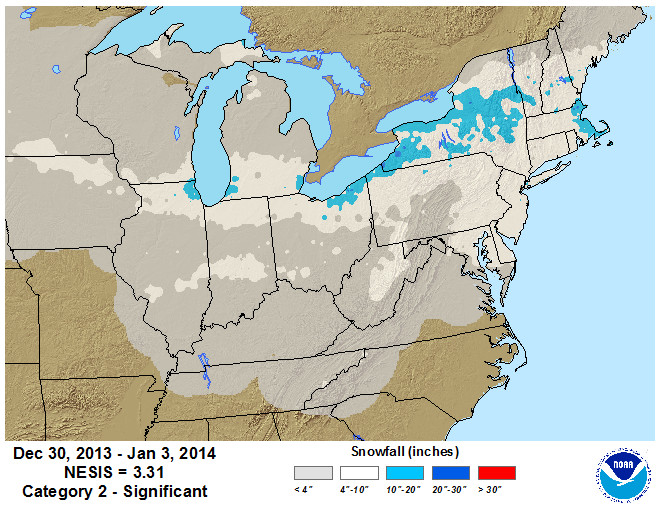
| 42 | 2013-12-30 | 2014-01-03 | 3.31 | 2 | Significant | view |
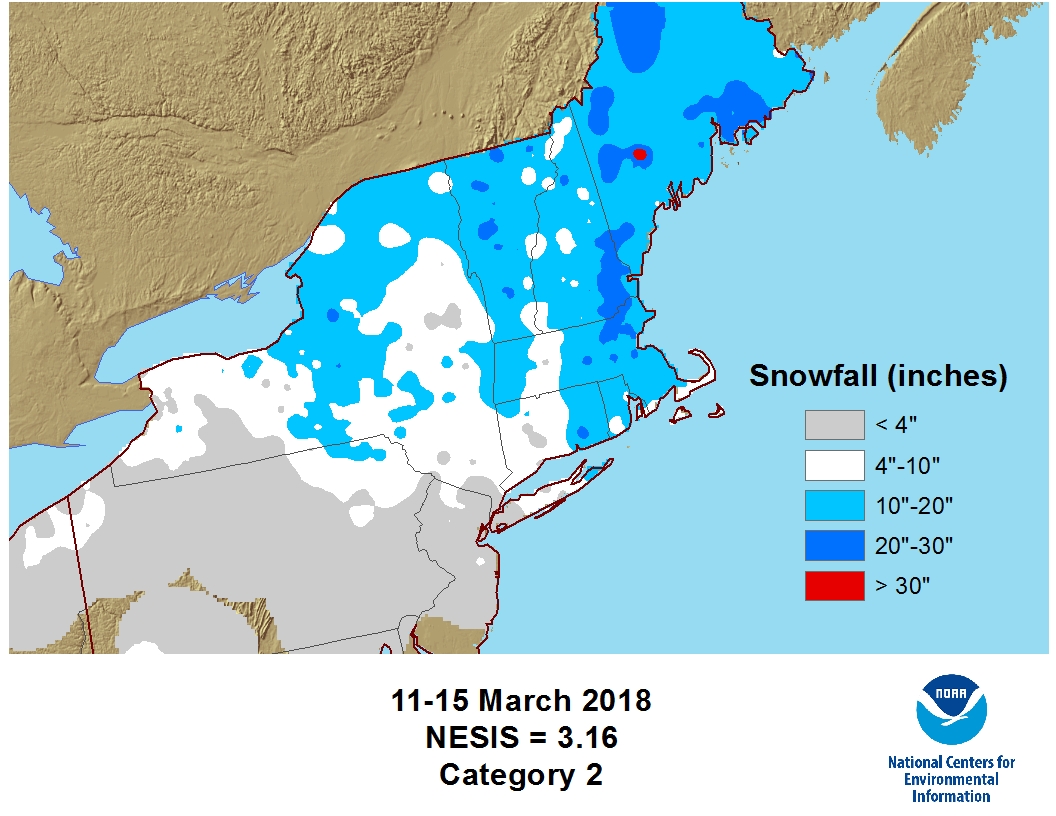
| 43 | 2018-03-11 | 2018-03-15 | 3.16 | 2 | Significant | view |
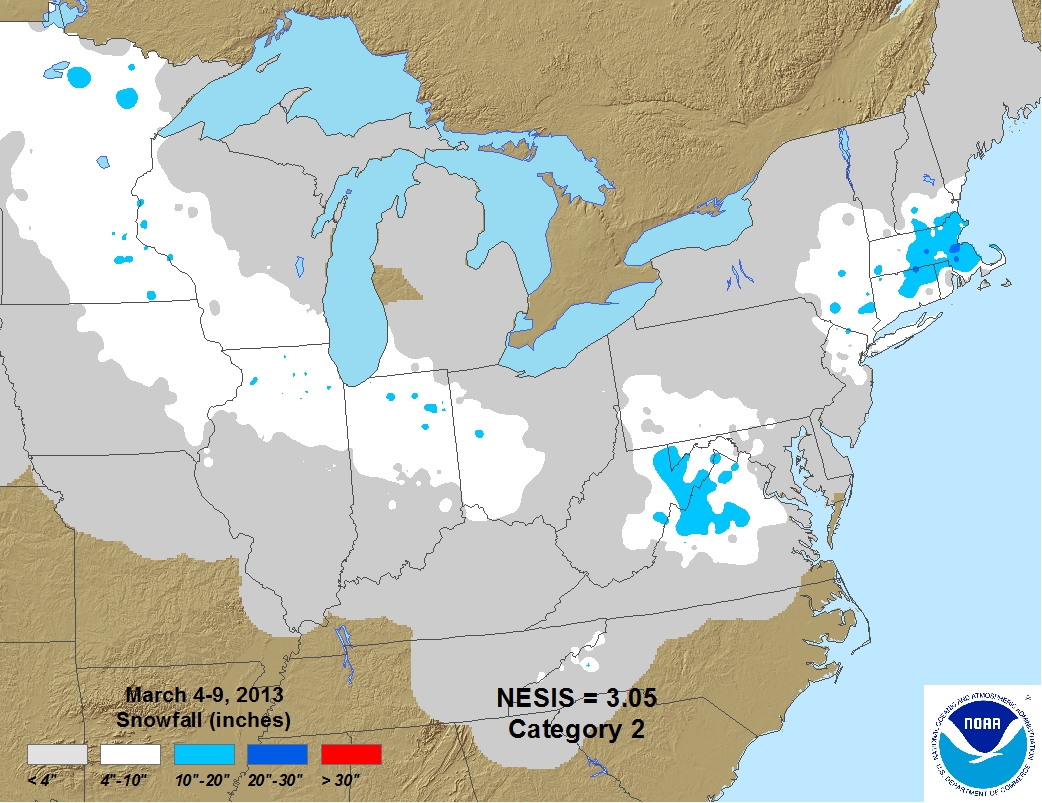
| 44 | 2013-03-04 | 2013-03-09 | 3.05 | 2 | Significant | view |
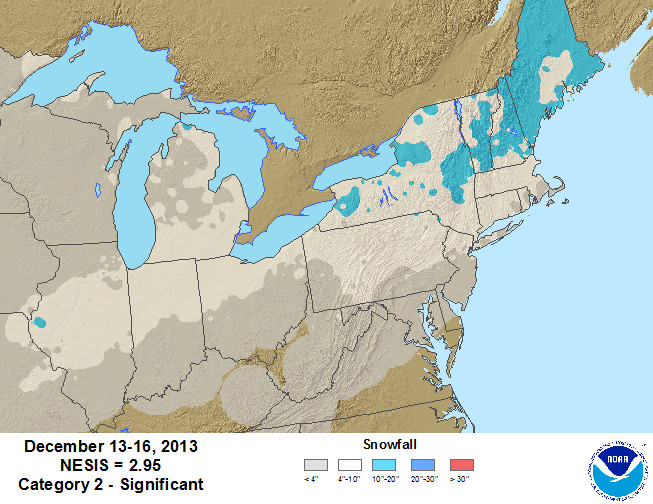
| 45 | 2013-12-13 | 2013-12-16 | 2.95 | 2 | Significant | view |
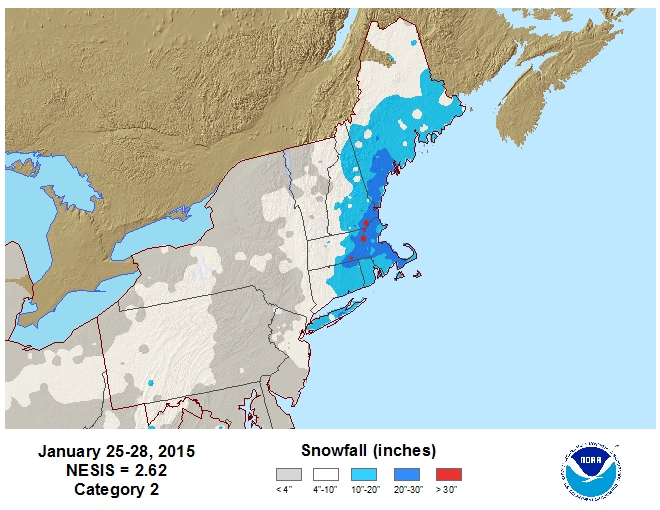
| 46 | 2015-01-25 | 2015-01-28 | 2.62 | 2 | Significant | view |
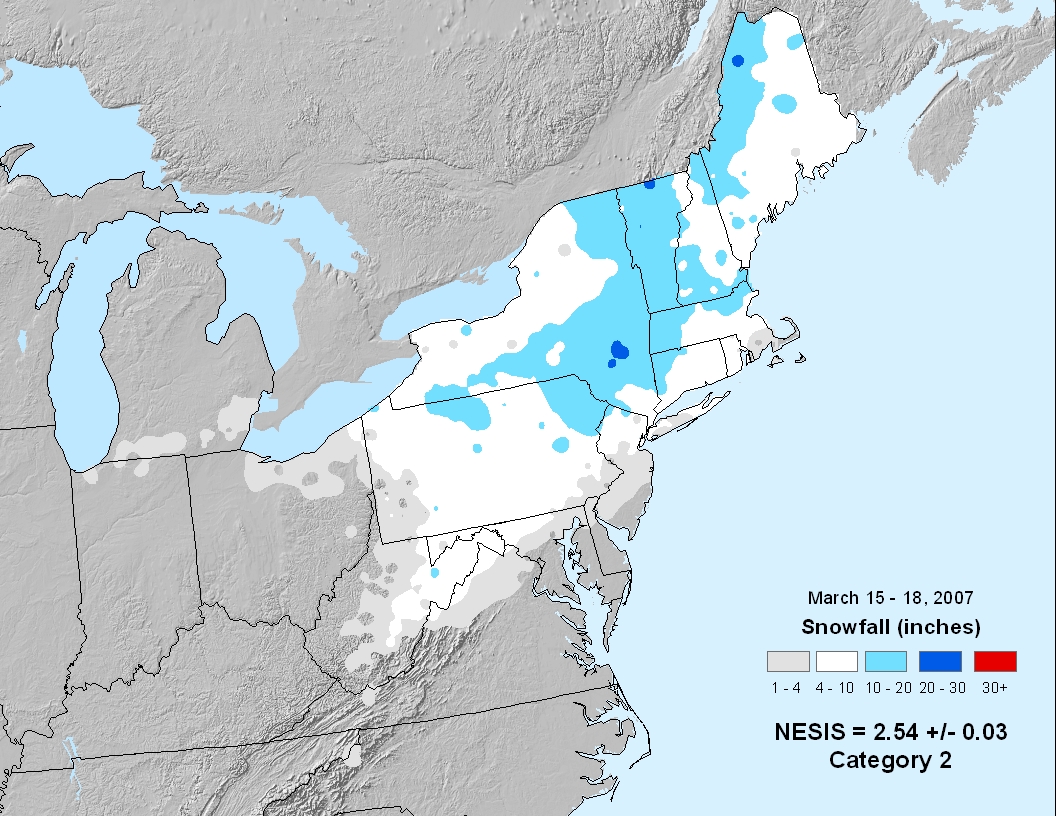
| 47 | 2007-03-15 | 2007-03-18 | 2.54 | 2 | Significant | view |
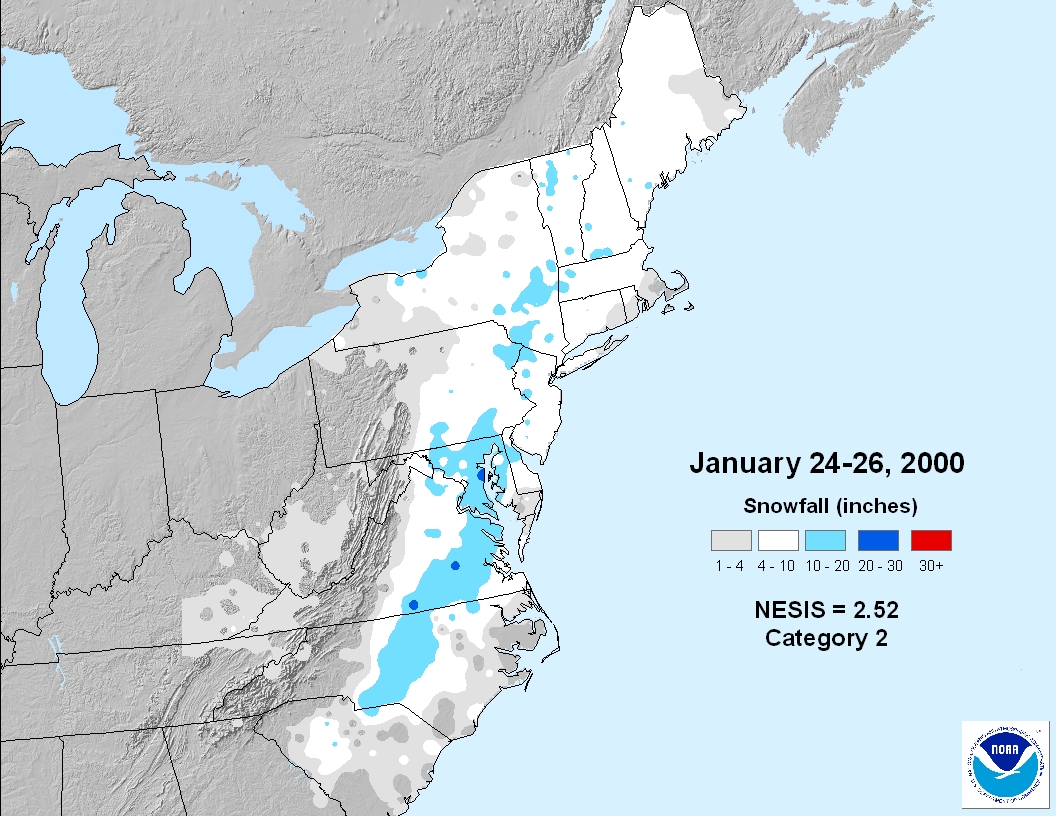
| 48 | 2000-01-24 | 2000-01-26 | 2.52 | 2 | Significant | view |
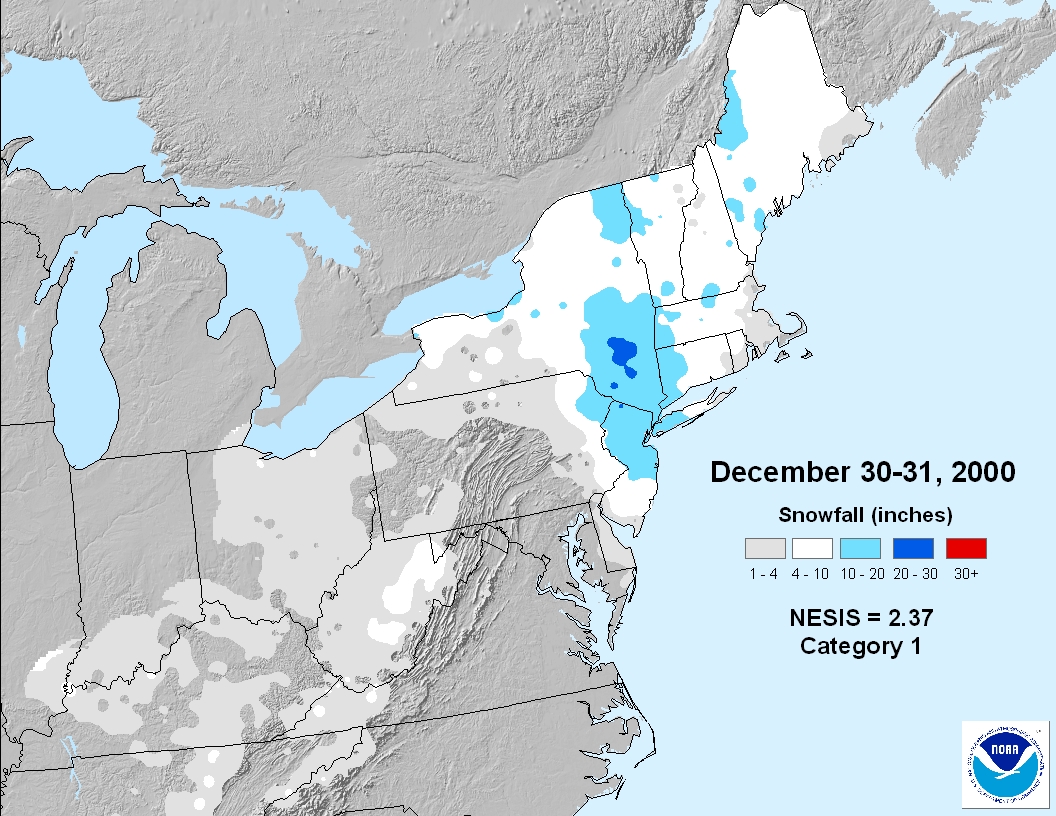
| 49 | 2000-12-30 | 2000-12-31 | 2.37 | 1 | Notable | view |
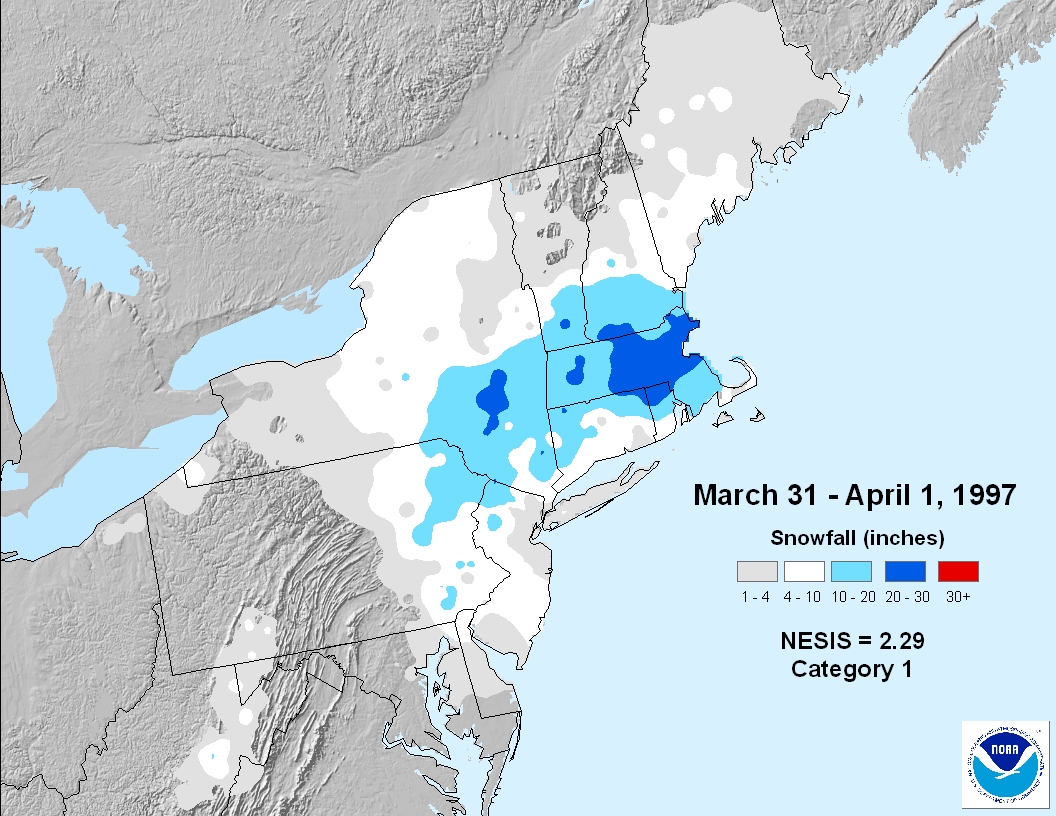
| 50 | 1997-03-31 | 1997-04-01 | 2.29 | 1 | Notable | view |
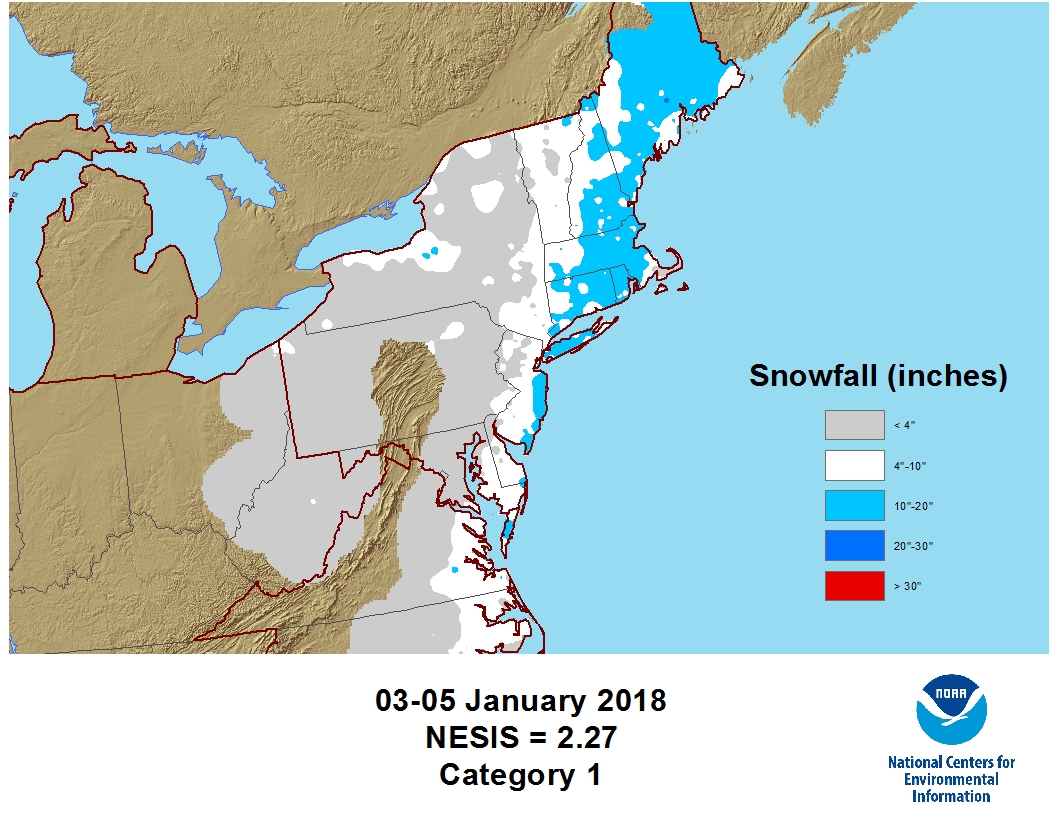
| 51 | 2018-01-03 | 2018-01-05 | 2.27 | 1 | Notable | view |
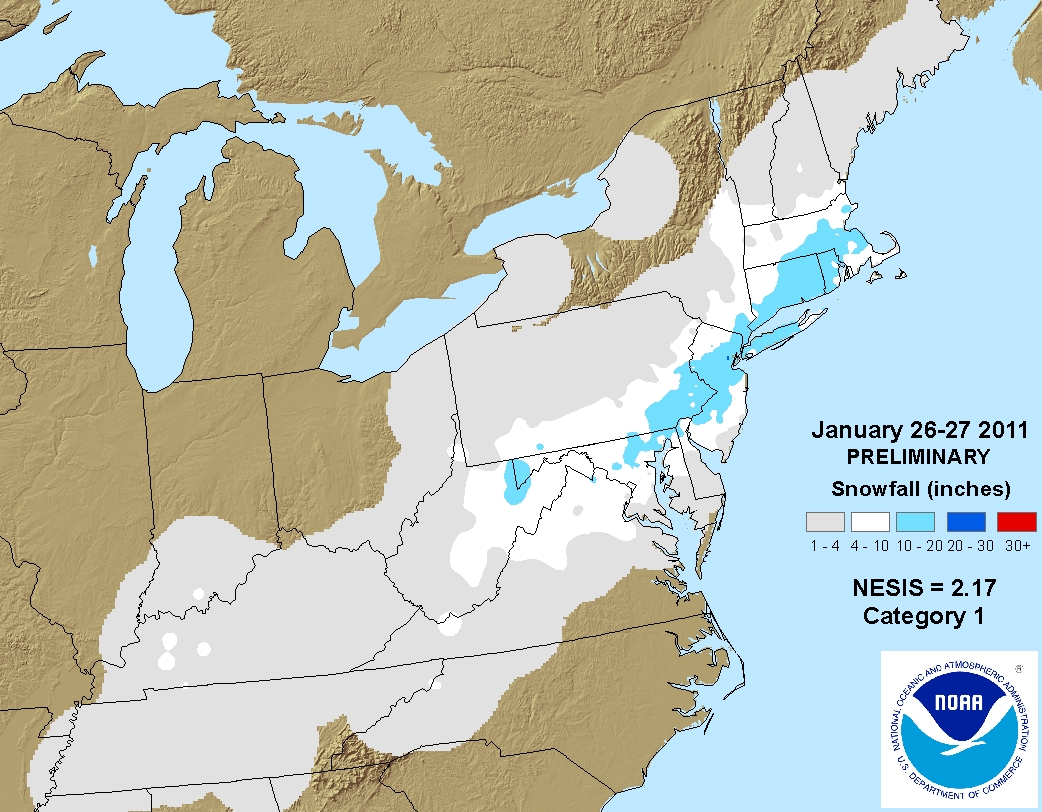
| 52 | 2011-01-26 | 2011-01-27 | 2.17 | 1 | Notable | view |
| 53 | 1956-03-18 | 1956-03-19 | 1.87 | 1 | Notable | view |
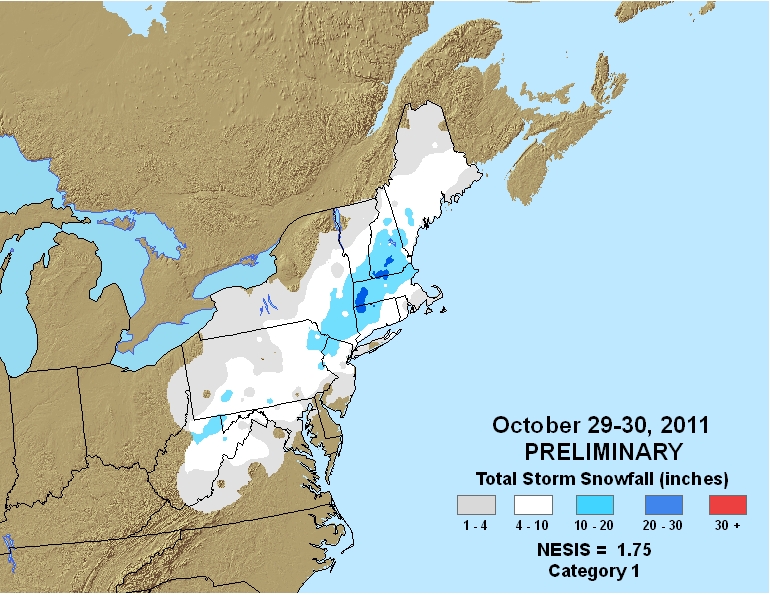
| 54 | 2011-10-29 | 2011-10-30 | 1.75 | 1 | Notable | view |
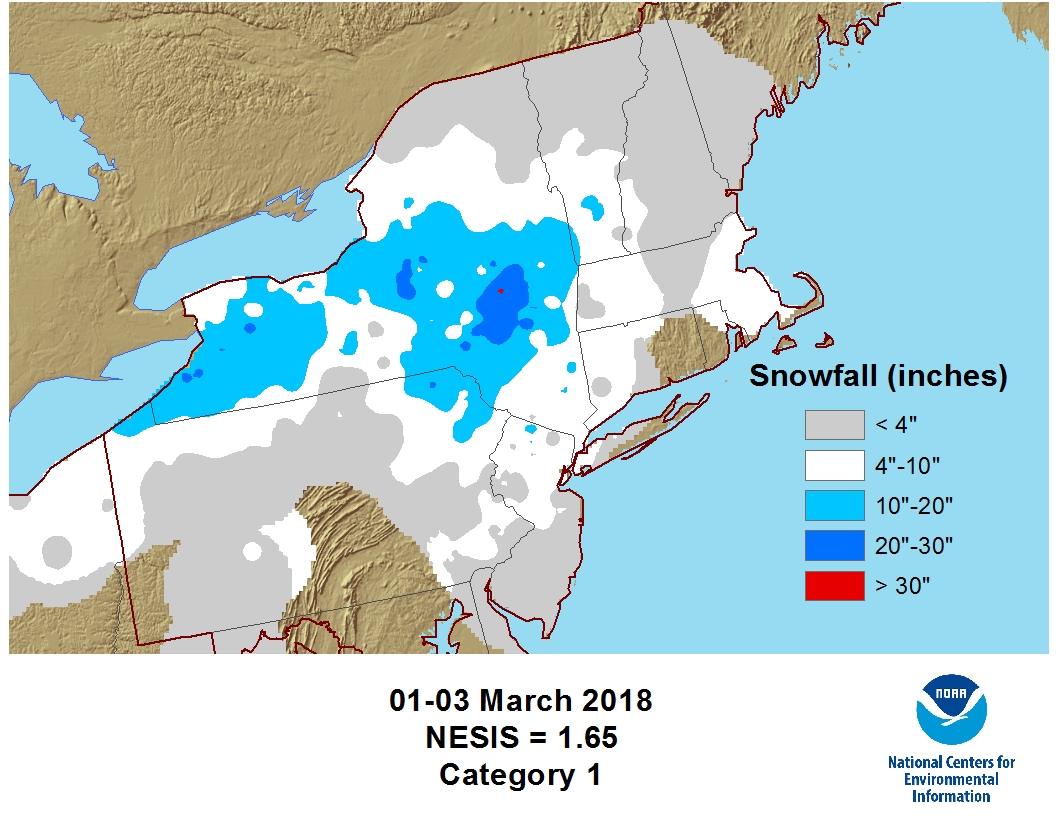
| 55 | 2018-03-01 | 2018-03-03 | 1.65 | 1 | Notable | view |
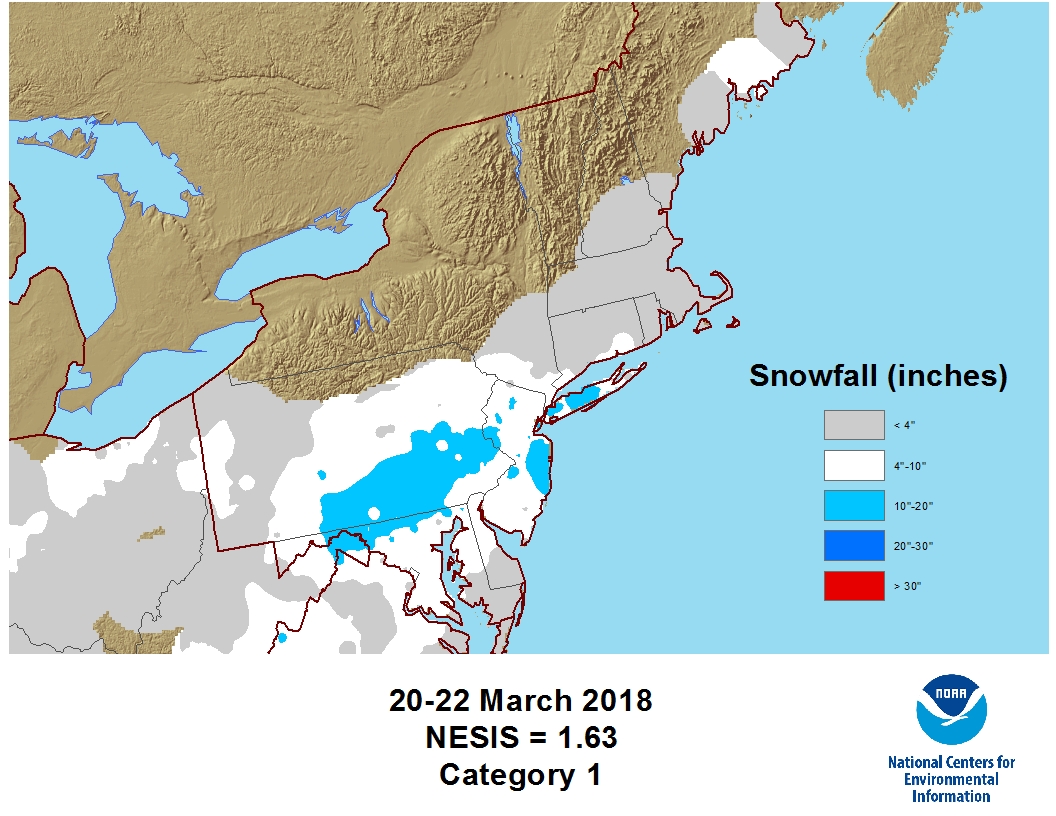
| 56 | 2018-03-20 | 2018-03-22 | 1.63 | 1 | Notable | view |
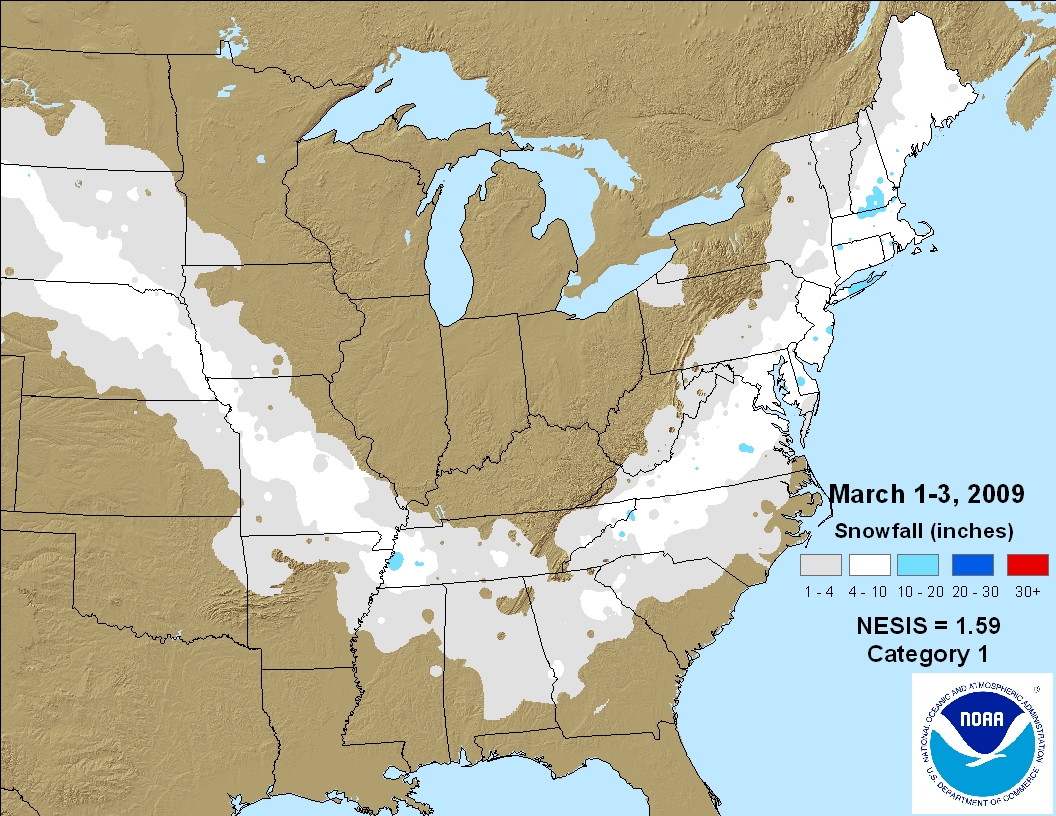
| 57 | 2009-03-01 | 2009-03-03 | 1.59 | 1 | Notable | view |
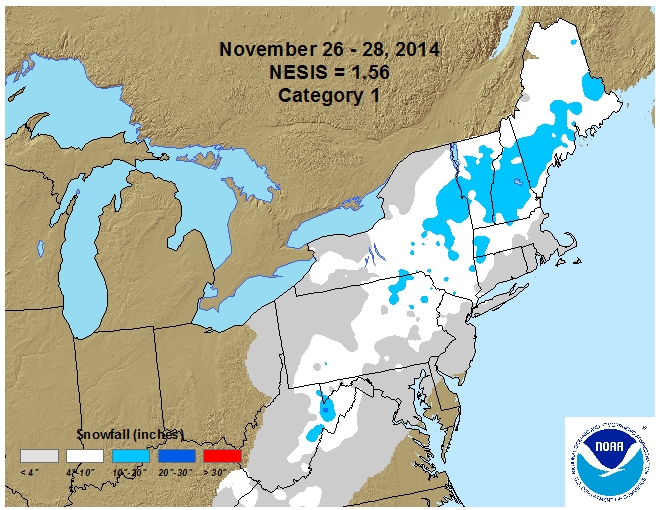
| 58 | 2014-11-26 | 2014-11-28 | 1.56 | 1 | Notable | view |
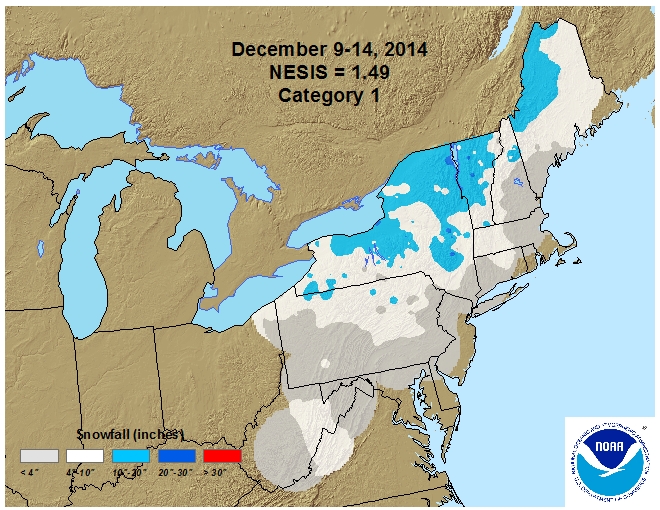
| 59 | 2014-12-09 | 2014-12-14 | 1.49 | 1 | Notable | view |
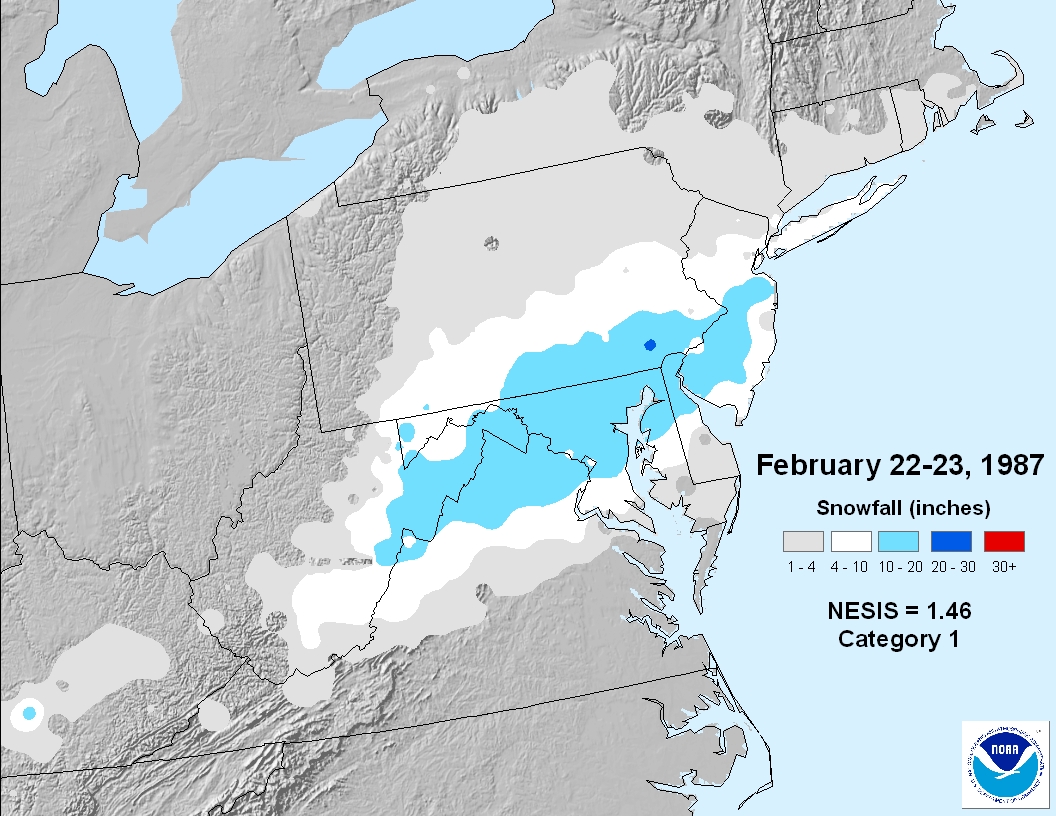
| 60 | 1987-02-22 | 1987-02-23 | 1.46 | 1 | Notable | view |
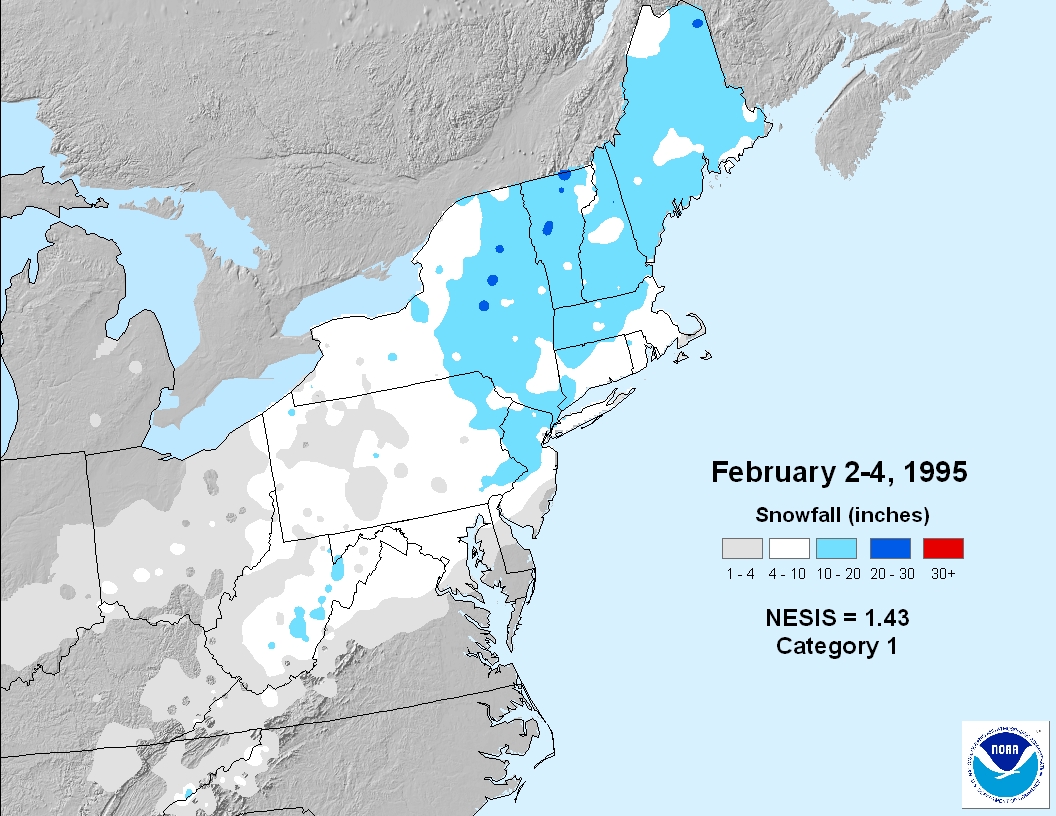
| 61 | 1995-02-02 | 1995-02-04 | 1.43 | 1 | Notable | view |
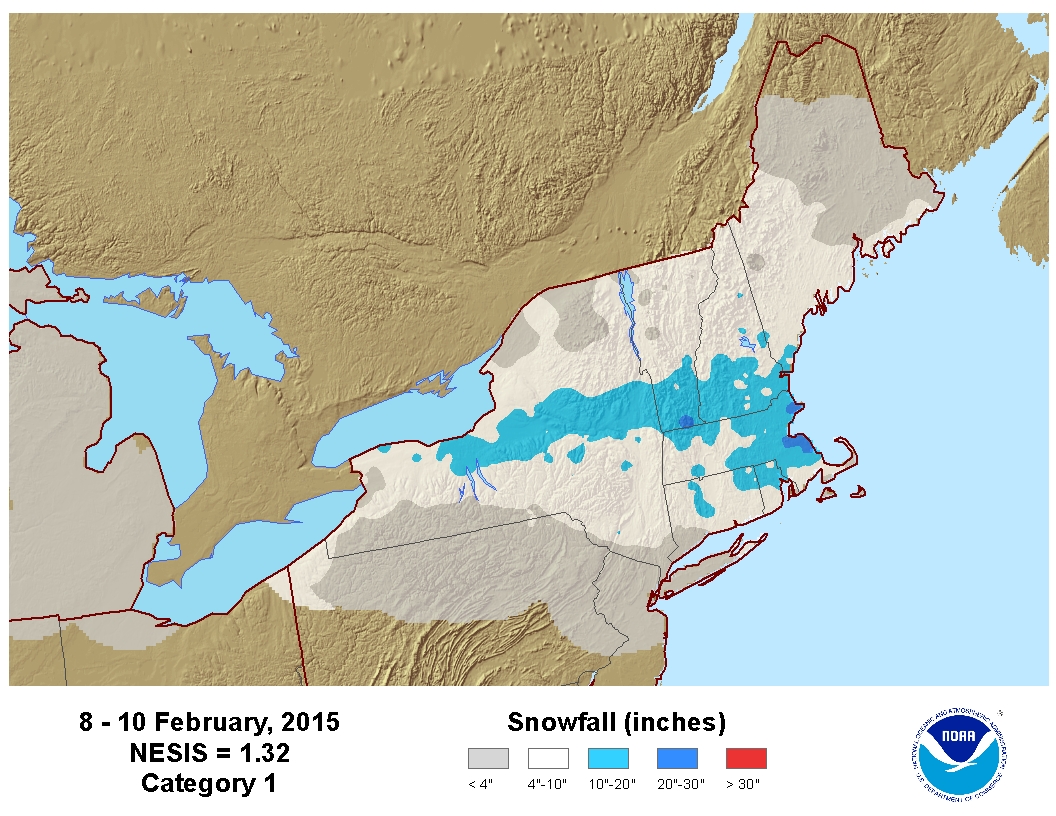
| 62 | 2015-02-08 | 2015-02-10 | 1.32 | 1 | Notable | view |
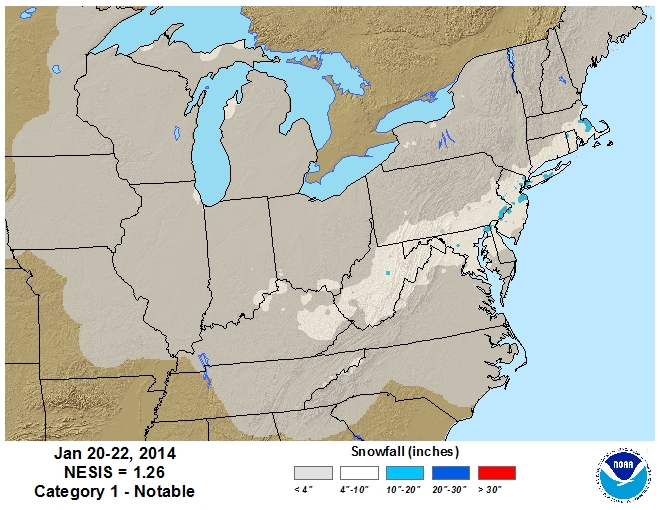
| 63 | 2014-01-20 | 2014-01-22 | 1.26 | 1 | Notable | view |
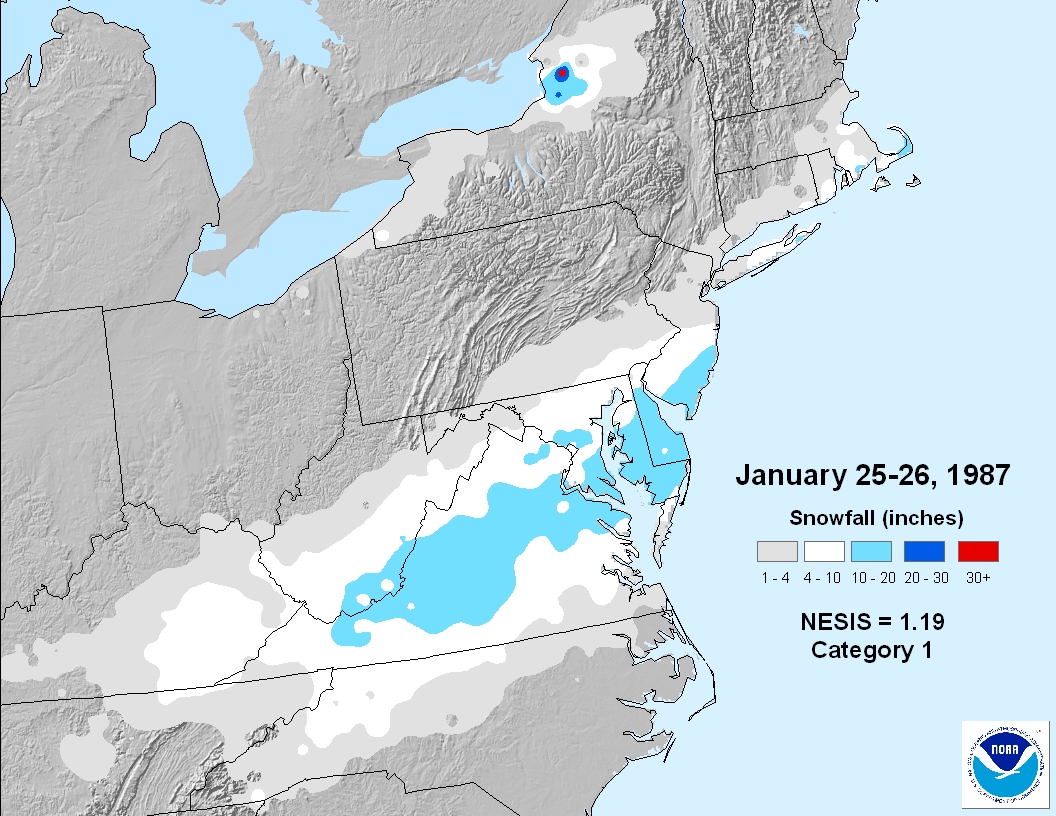
| 64 | 1987-01-25 | 1987-01-26 | 1.19 | 1 | Notable | view |
References:
- Kocin, P. J. and L. W. Uccellini, 2004: A Snowfall Impact Scale Derived From Northeast Storm Snowfall Distributions. Amer. Meteor. Soc., 85, 177-194
- Squires, M. F. and J. H. Lawrimore, 2006: Development of an Operational Snowfall Impact Scale. 22ndIIPS, Atlanta, GA.
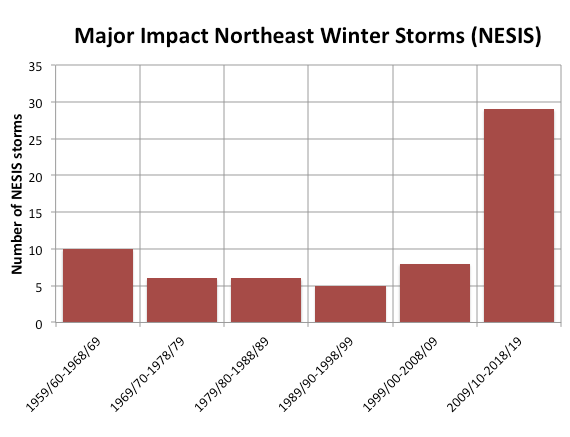
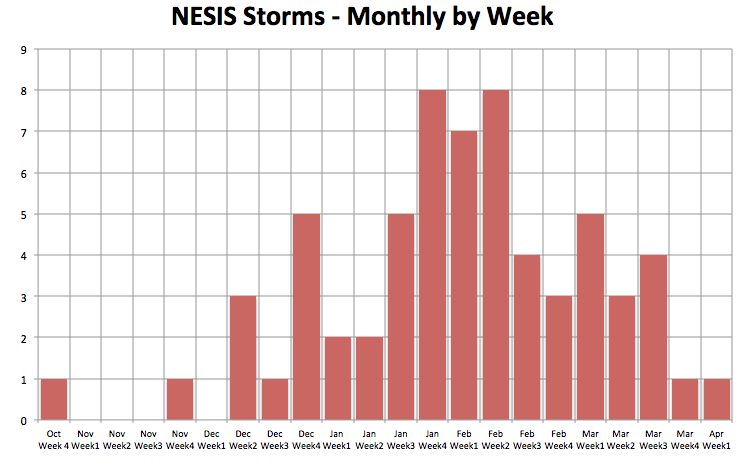
December sees a pop climatologically speaking. It rises to a peak in February with a slow decline as spring approaches.
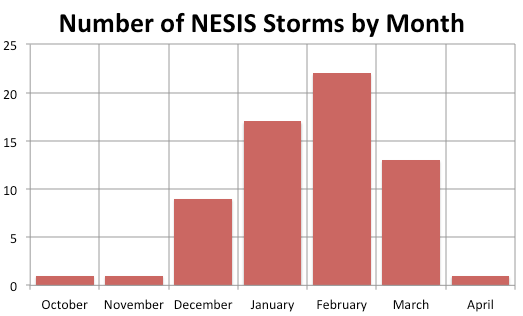
Weekly, the second week in December has had 3 such storms, Christmas week has had 5, mid January also has had 5, with 7 to 8 per week in late January to mid February. It drops off some through the first 3 weeks of March then chances are low into April.
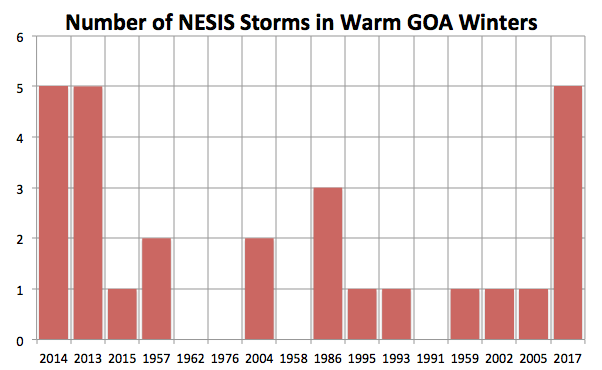
Oceans play a role in the development of these storms. A warm Atlantic and also a warm pool in the Gulf of Alaska can combine and make big storms more likely.
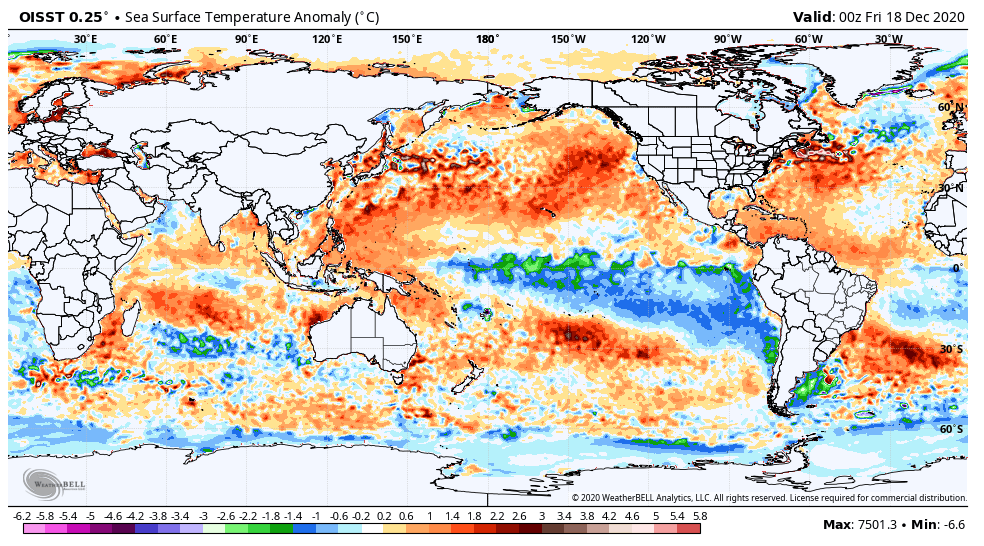
These conditions were common since 2007/08.
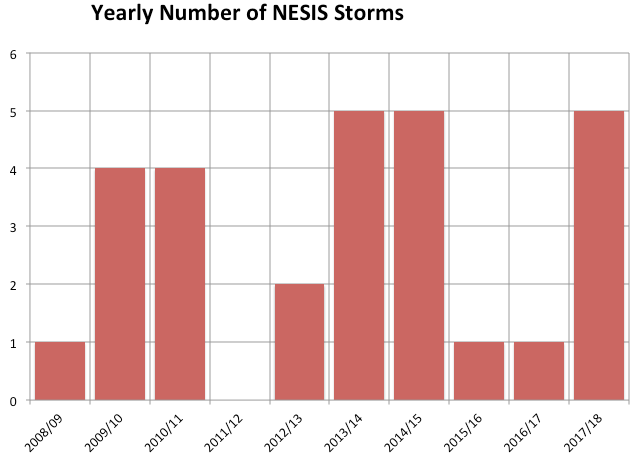
The last decade, when these conditions existed, was a blockbuster with a total of 29 NESIS events.