No doubt for areas of the coast affected by the storms, it was a year reminiscent of recent 2017 and 2005 seasons.
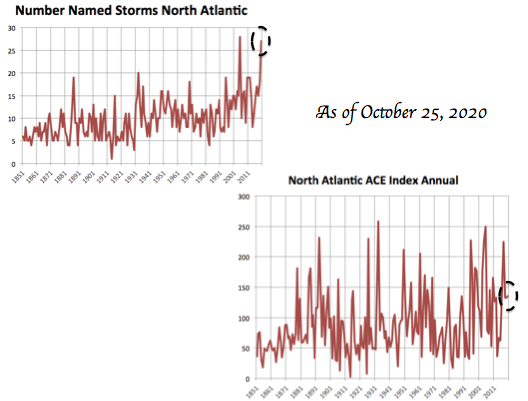
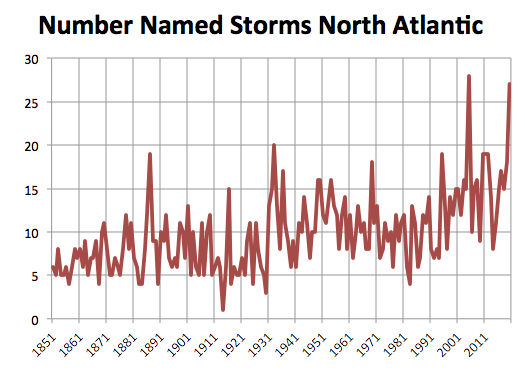
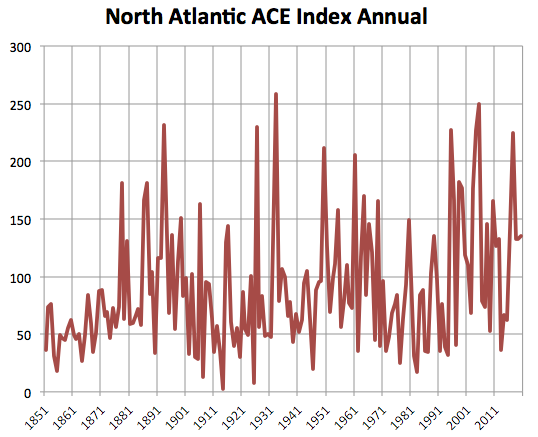
Though we about to tie the record for number of named storms (now at 27 versus 28 in 2005), we are running 152% of normal for the Atlantic Basin ACE (Accumulated Cyclone Energy Index) – very close to 2019 (148%) and 2018 (149%) but running well behind 2017 (252%), 2005 (280%) and 1933 (290%).
Note while the Atlantic was active, the Pacific was quiet and the Northern Hemisphere was just 68.2% of normal.
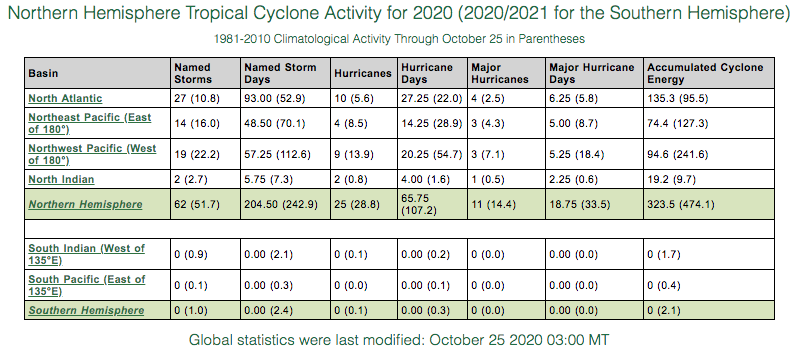
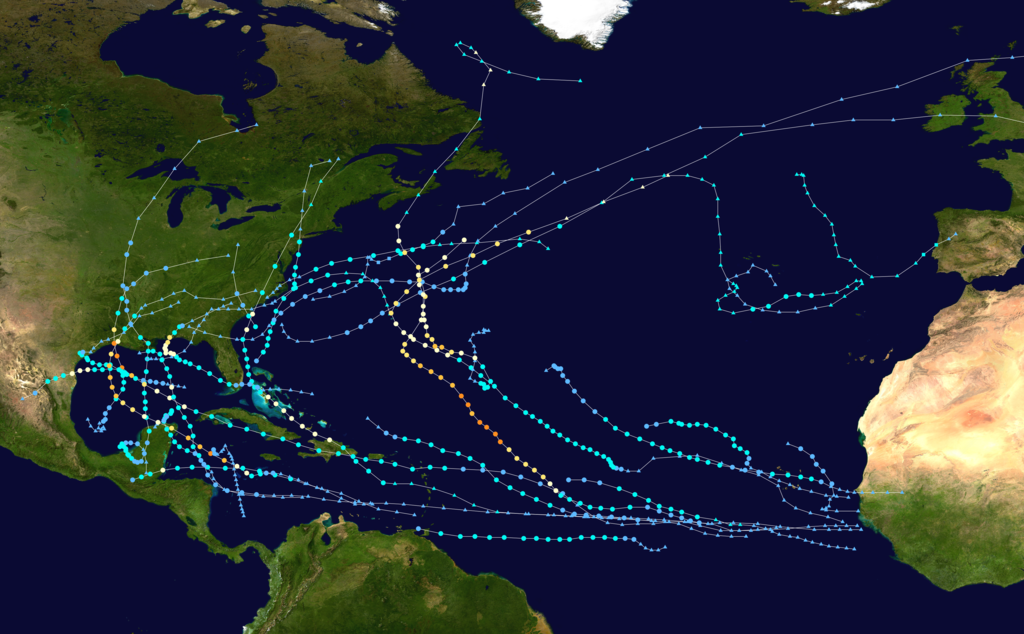
See the storm tracks including 10 hurricanes and 4 majors.
Real-Time North Atlantic Ocean Statistics by Storm for 2020
| Year | Storm# | Name | Dates TC Active | Max Wind (kts) | MSLP (mb) | Named Storm Days | Hurricane Days | Major Hurricane Days | Accumulated Cyclone Energy |
| 2020 | 1 | ARTHUR | 5/17-5/19 | 50 | 991 | 2.50 | 0.00 | 0.00 | 1.8 |
| 2020 | 2 | BERTHA | 5/27-5/27 | 45 | 1007 | 0.50 | 0.00 | 0.00 | 0.4 |
| 2020 | 3 | CRISTOBAL | 6/2-6/8 | 50 | 992 | 4.75 | 0.00 | 0.00 | 3.5 |
| 2020 | 4 | DOLLY | 6/23-6/24 | 40 | 1002 | 1.00 | 0.00 | 0.00 | 0.6 |
| 2020 | 5 | EDOUARD | 7/6-7/6 | 40 | 1005 | 1.00 | 0.00 | 0.00 | 0.6 |
| 2020 | 6 | FAY | 7/9-7/11 | 50 | 998 | 1.50 | 0.00 | 0.00 | 1.1 |
| 2020 | 7 | GONZALO | 7/22-7/25 | 55 | 997 | 3.50 | 0.00 | 0.00 | 2.8 |
| 2020 | 8 | HANNA | 7/24-7/26 | 75 | 973 | 3.00 | 0.75 | 0.00 | 3.4 |
| 2020 | 9 | ISAIAS | 7/30-8/4 | 75 | 987 | 6.00 | 2.25 | 0.00 | 9.2 |
| 2020 | 10 | JOSEPHINE | 8/13-8/16 | 40 | 1005 | 3.00 | 0.00 | 0.00 | 1.8 |
| 2020 | 11 | KYLE | 8/14-8/16 | 45 | 1000 | 1.50 | 0.00 | 0.00 | 1.0 |
| 2020 | 12 | LAURA | 8/21-8/28 | 130 | 938 | 6.75 | 2.25 | 1.00 | 12.8 |
| 2020 | 13 | MARCO | 8/22-8/25 | 65 | 991 | 3.25 | 0.25 | 0.00 | 3.4 |
| 2020 | 14 | OMAR | 9/2-9/2 | 35 | 1003 | 0.75 | 0.00 | 0.00 | 0.4 |
| 2020 | 15 | NANA | 9/1-9/3 | 65 | 994 | 2.75 | 0.25 | 0.00 | 2.6 |
| 2020 | 16 | PAULETTE | 9/7-9/22 | 90 | 965 | 10.25 | 3.50 | 0.00 | 15.9 |
| 2020 | 17 | RENE | 9/7-9/12 | 45 | 1000 | 4.00 | 0.00 | 0.00 | 2.2 |
| 2020 | 18 | SALLY | 9/12-9/17 | 90 | 967 | 4.50 | 2.00 | 0.00 | 7.4 |
| 2020 | 19 | TEDDY | 9/14-9/23 | 120 | 945 | 9.00 | 7.25 | 2.75 | 27.8 |
| 2020 | 20 | VICKY | 9/14-9/17 | 45 | 1000 | 3.00 | 0.00 | 0.00 | 2.1 |
| 2020 | 21 | BETA | 9/18-9/22 | 50 | 994 | 4.00 | 0.00 | 0.00 | 3.3 |
| 2020 | 22 | WILFRED | 9/18-9/20 | 35 | 1007 | 1.75 | 0.00 | 0.00 | 0.9 |
| 2020 | 23 | ALPHA | 9/18-9/18 | 45 | 998 | 0.50 | 0.00 | 0.00 | 0.4 |
| 2020 | 24 | GAMMA | 10/3-10/5 | 60 | 980 | 2.75 | 0.00 | 0.00 | 2.5 |
| 2020 | 25 | DELTA | 10/5-10/10 | 120 | 953 | 5.25 | 4.25 | 2.00 | 15.7 |
| 2020 | 26 | EPSILON | 10/19-10/25 | 100 | 952 | 6.00 | 4.50 | 0.50 | 12.0 |
| 2020 | 27 | ZETA | 10/25-10/25 | 35 | 1005 | 0.25 | 0.00 | 0.00 | 0.1 |
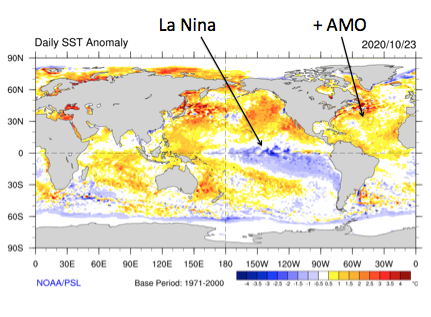
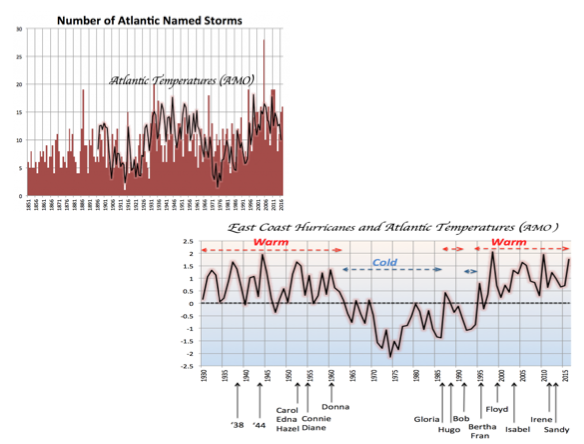
Activity was shown decades ago to relate to the AMO (Atlantic Multidecadal Oscillation) cycle with active seasons favored in the warm decades and quieter ones in cold ones. Likewise when La Ninas are present suppressing eastern Pacific storms which can disrupt upper level winds in the Atlantic, action in the Atlantic is more favored. Both a warm AMO and La Nina are present this year.
See how the number of major hurricanes in the Atlantic tracks with the AMO.
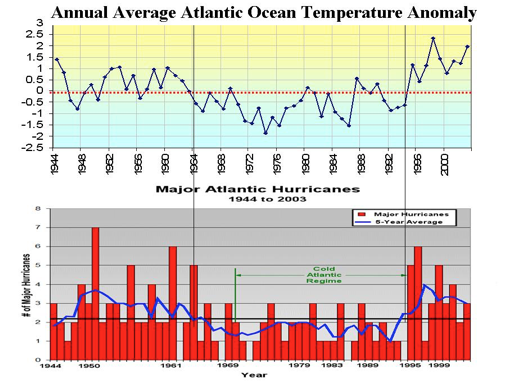
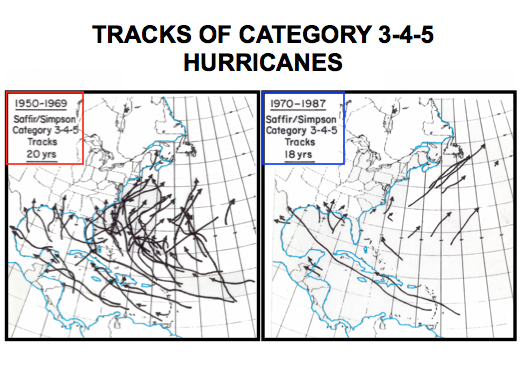
See the last warm period 1950-1969 versus the cold 1970-1987 period.
When the AMO >1 STD, the ACE averages 140.1. When it is more than 1 STD negative, the ACE averages just 49.9.
As noted, the other key is ENSO. El Ninos increase the upper level shear in the Atlantic by favoring much more action in the eastern Pacific. Those storms disturb the upper level flow increasing shear over disturbances trying to develop. In La Ninas like 2020, the shear is less allowing more disturbances to grow to storm status. Indeed when the NINO34 is warm (>1 STD), the ACE averages 109.2 and when more than 1 STD negative (La Nina), it is just 42.4.
AN ATLANTIC THREAT INDEX
If we create an Index of AMO minus the NINO34 STD values we would expect when significantly positive (>1 STD), the Atlantic Basin should be more active and when > 1 STD negative, quiet. See how the ACE tracks well with that index.
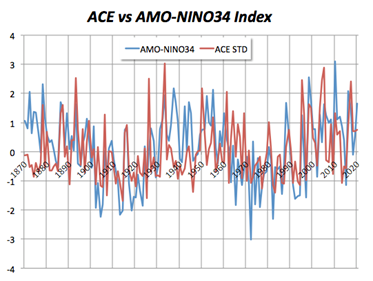
On average when the Index is > 1 STD, we have an average ACE of 140.1, when it is more than 1 STD negative, the average is 49.9.
Despite years with more storms, the number of landfalling hurricanes and major hurricanes for the mainland has been declining with the last decade the second quietest since 1950.
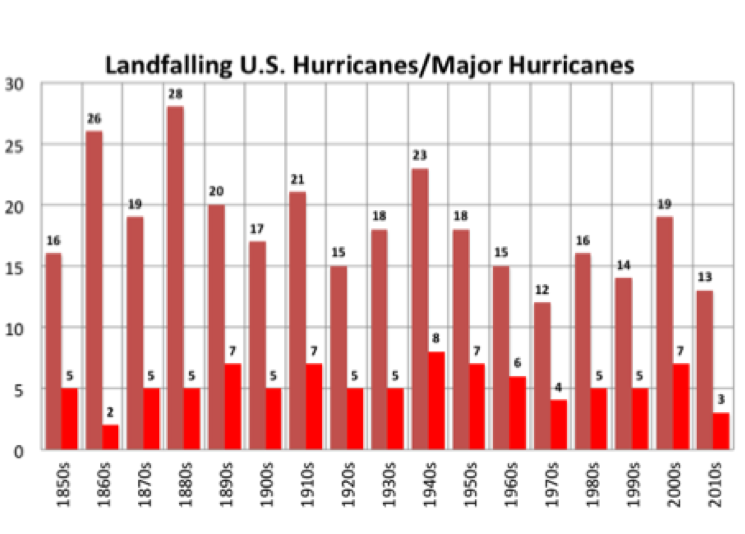
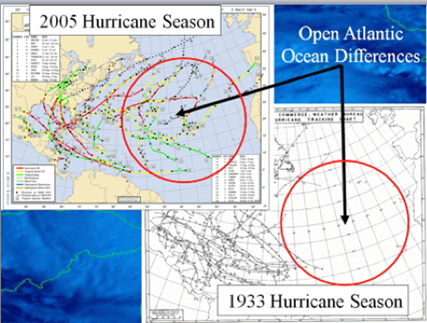
Landfalling storms is the best measure of trends as before the satellite era we missed many often short lived storms in the eastern Atlantic. Even in the record ACE season of 1933 (ACE of 258.6 versus 135.2 this season) you can see we probably missed storms.