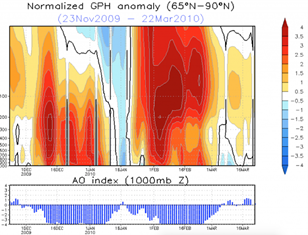
The chart below shows a time series of the polar atmosphere from top to bottom (red is high pressure and warmer temperatures and blue low pressure and cold arctic temperatures). October previewed a December/January polar warming now underway.
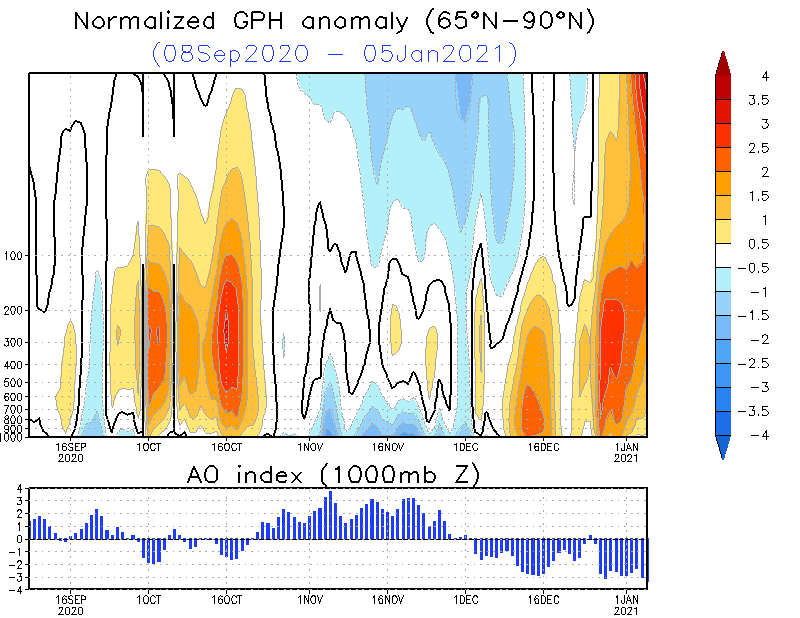
That event, called a Sudden Stratospheric Warming, increases surface pressures and atmospheric temperatures in the polar atmosphere. This affects one of the phenomena we watch closely in winter called the Arctic Oscillation.
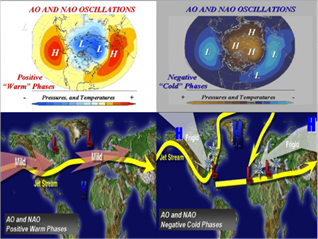
The Arctic Oscillation (AO) is a large-scale mode of climate variability featuring large- scale differences from the polar regions to mid-latitudes. The Atlantic extension of the AO called the North Atlantic Oscillation (NAO) is especially important for the Eastern United States and Western Europe. The positive AO (left side of below graphic) and NAO modes produce more westerly winds in mid latitudes that bring milder ocean air into North America from the Pacific and into Europe from the Atlantic. The negative mode (right side) sees the flow pattern buckle and pushes cold air south to middle latitudes affecting Russia, Europe and North America.
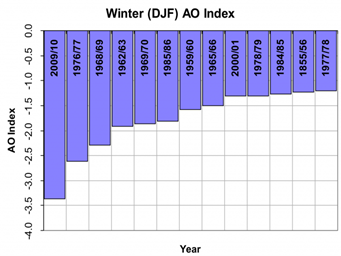
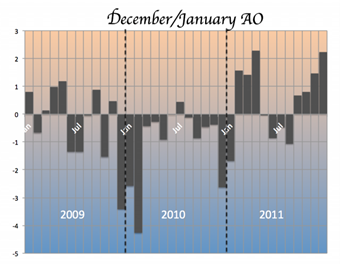
It has been a decade or so since the last such a strong Negative AO event (2009/10 and 2010/11).
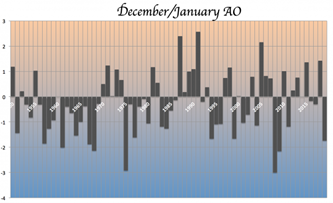
The most impressive winter 2009/10 was an El Nino and its winter AO beat out the memorable 1976/77 winter for the most negative AO since 1950.
Look at the extensive polar warming and off the scale AO that winter.
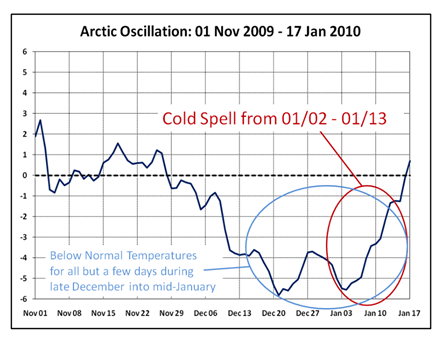
The very negative AO led to record snows (a blitz that got the name Snowmaggedon) for the Mid-Atlantic, a region where Negative AO/NAO El Ninos mean business.
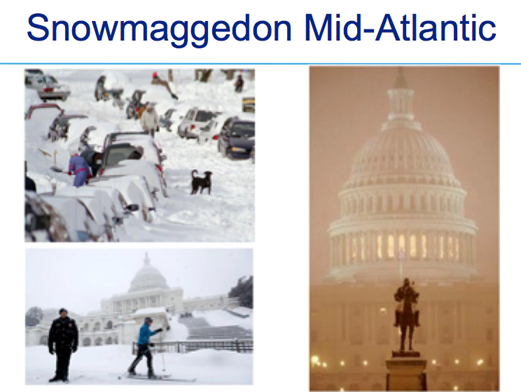
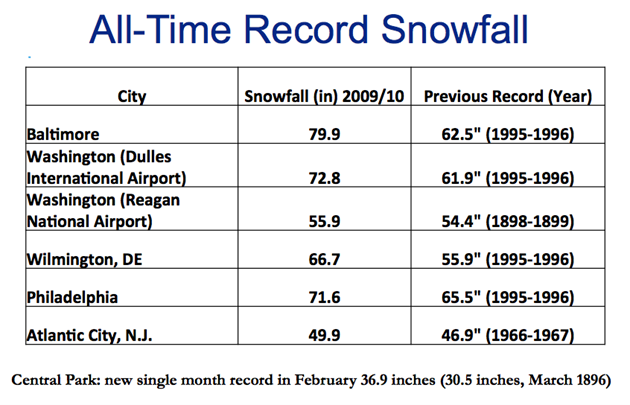
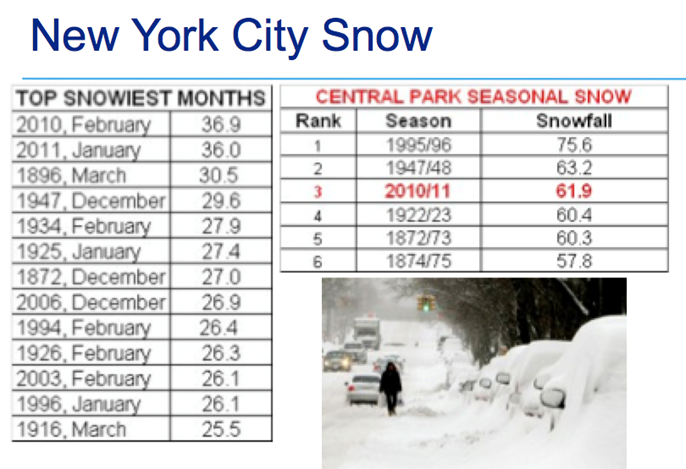
The winter ended with a record snow month in New York City with 36.9 inches in March.
The next winter (2010/11) was a La Nina and December and January had a negative AO though without a Sudden Stratospheric Warming. The snows were big again but were further north. New York City again was hit hard with 36 inches in January. The winter there ended up with 61.0, 3rd highest since the 1870s.
See the negative AO in December and January in 2010/11.
The AO and NAO and the cold was aided by Eyjafjallajokull volcano in Iceland on 2010, which continued the string of high latitude eruptions that started in 2007. High latitude volcanism has been shown to lead to negative AO/NAO blocking patterns and snowstorms in Europe and the eastern U.S.
The Central England Temperature record is one of the longest continuous temperature record in the world, extending back to the Little Ice age in 1659. December 2010 was the coldest December in 120 years with an average of -0.7C just short of the record of -0.8C recorded in December 1890. It was the Second Coldest December Temperature in the entire record (352 years).
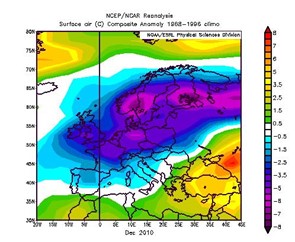
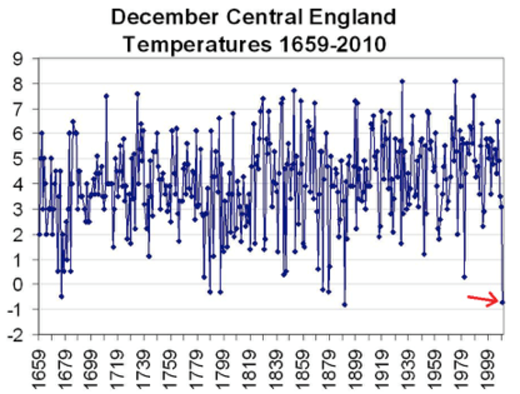
In addition to the cold, heavy snow hampered travel by air, rail, and road. In Ireland, this was the coldest start to winter in 130 years, when general records began. According to Met Eireann, Ireland’s meteorological service, December was the coldest month ever on record. County Mayo recorded low temperatures of -17.2C (+1F).
THIS JANUARY
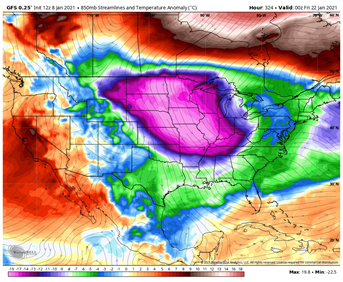
The US model GFS is interesting later week 2 as true arctic air invades as pressures build in the arctic and sub-arctic.
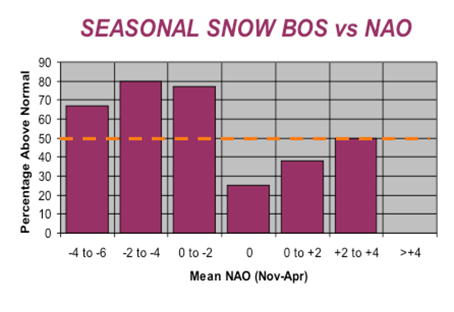
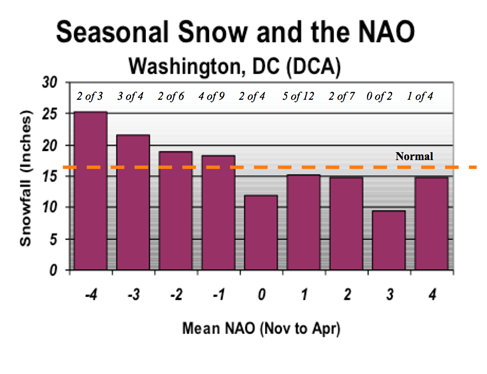
The North Atlantic Oscillation is an extension of the AO. Usually they are both either positive or negative. We have documented how a negative NAO affects snow in Boston and Washington DC.
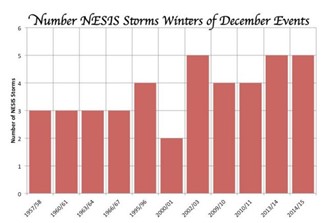
Stratospheric warming events typically last 30 days or so. When it fades, the trough should retrogress west like most La Ninas. Until then expect some harsh winter challenges. Climatology favors it. Since 1956, big December snow events were followed by 1 to 4 more such storms those winters.